AP Microeconomics
Understanding Externalities
An externality occurs when a cost or benefit of a transaction spills over onto third parties who were not directly involved. Negative externalities like pollution cause overproduction, but a properly set per-unit tax can align private and social costs and eliminate deadweight loss.
Printable Cheat Sheets for Every Unit
Everything you need to ace your exam, all on a single page.
Download PDF Cheat SheetsIn Unit 2, we learned that when the government intervenes in a perfectly competitive market through taxes or price controls, they usually create Deadweight Loss (DWL). They are essentially the villain of market efficiency.
However, Unit 6 flips the script. Here, the government steps in as the hero to fix markets that have already failed on their own. This is the world of Externalities.
What is an Externality?
An externality occurs when a cost or benefit impacts a third party who was not involved in the transaction.
Imagine a factory producing chemicals. To make those chemicals, the factory pays for electricity, raw materials, and labor. These are Marginal Private Costs (MPC). But suppose the factory also dumps waste into a nearby stream.
The impact: Fishermen catch fewer fish, swimmers get sick, and the local ecosystem collapses.
The result: These people are bearing a cost for a product they didn't buy or produce. This is a Marginal External Cost (MEC).
The Math of Market Failure
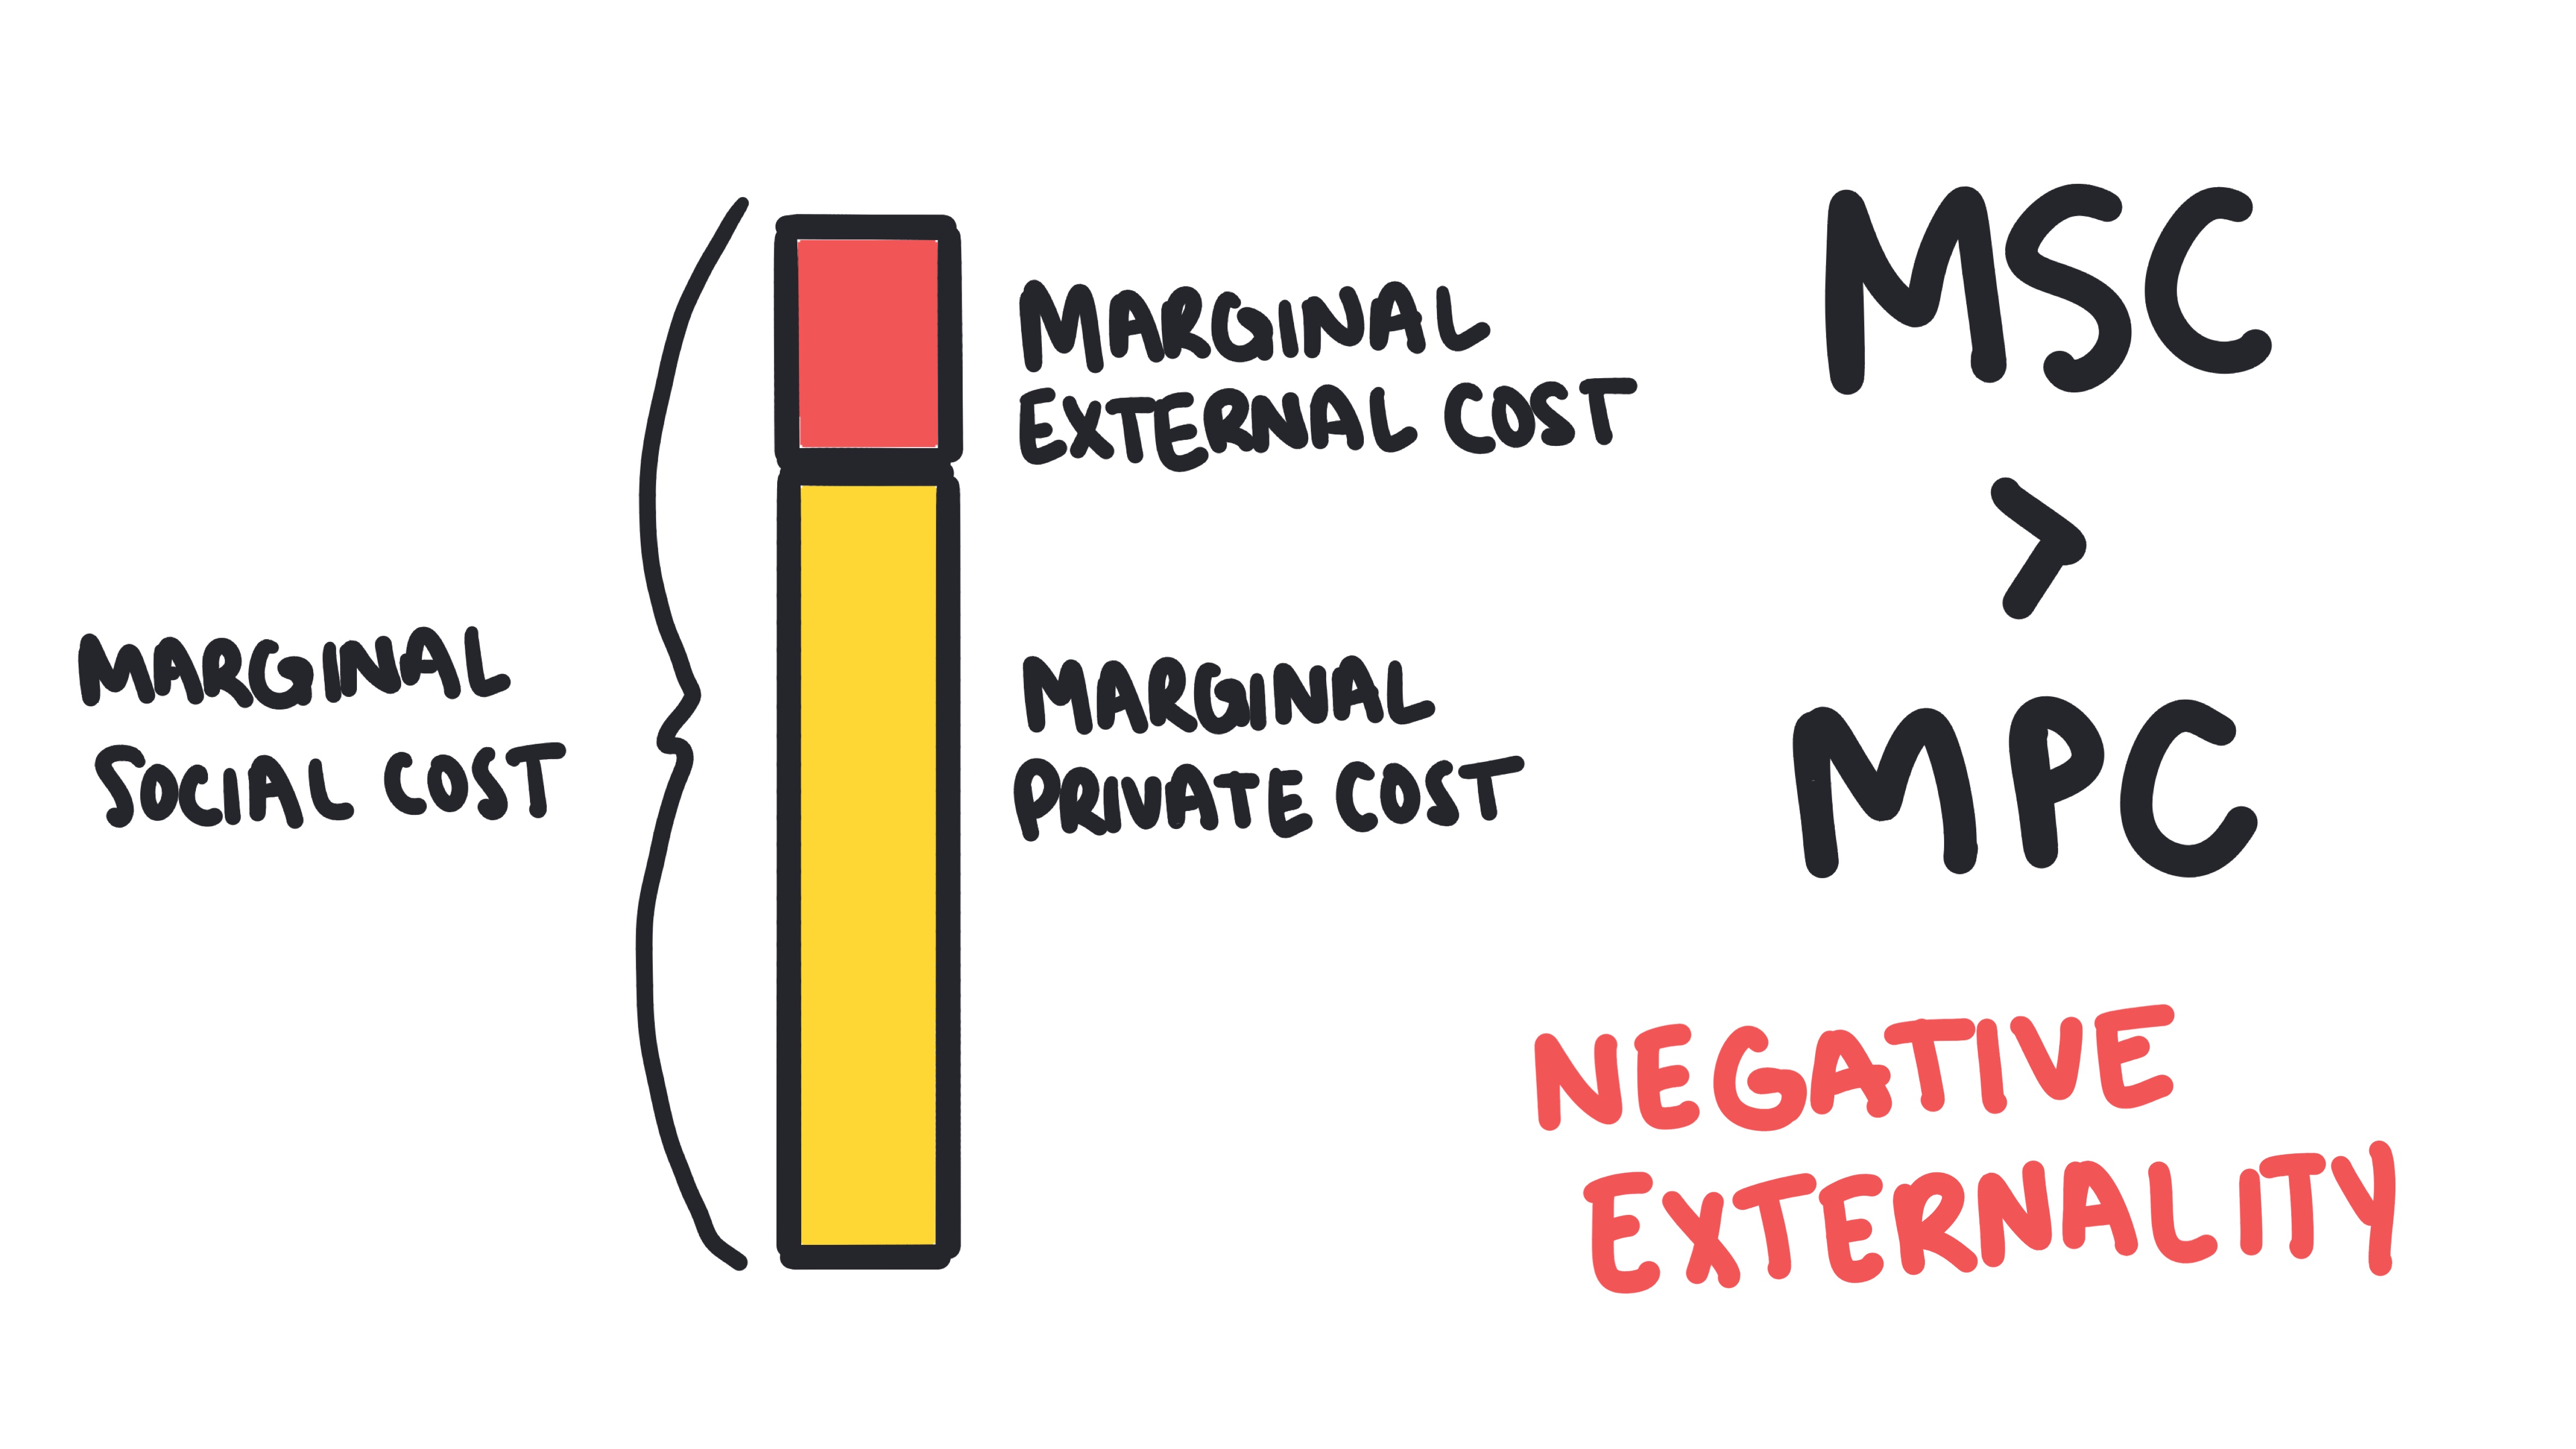
When we add the factory's private costs to the external costs borne by the community, we get the Marginal Social Cost (MSC).
MSC = MPC + MEC
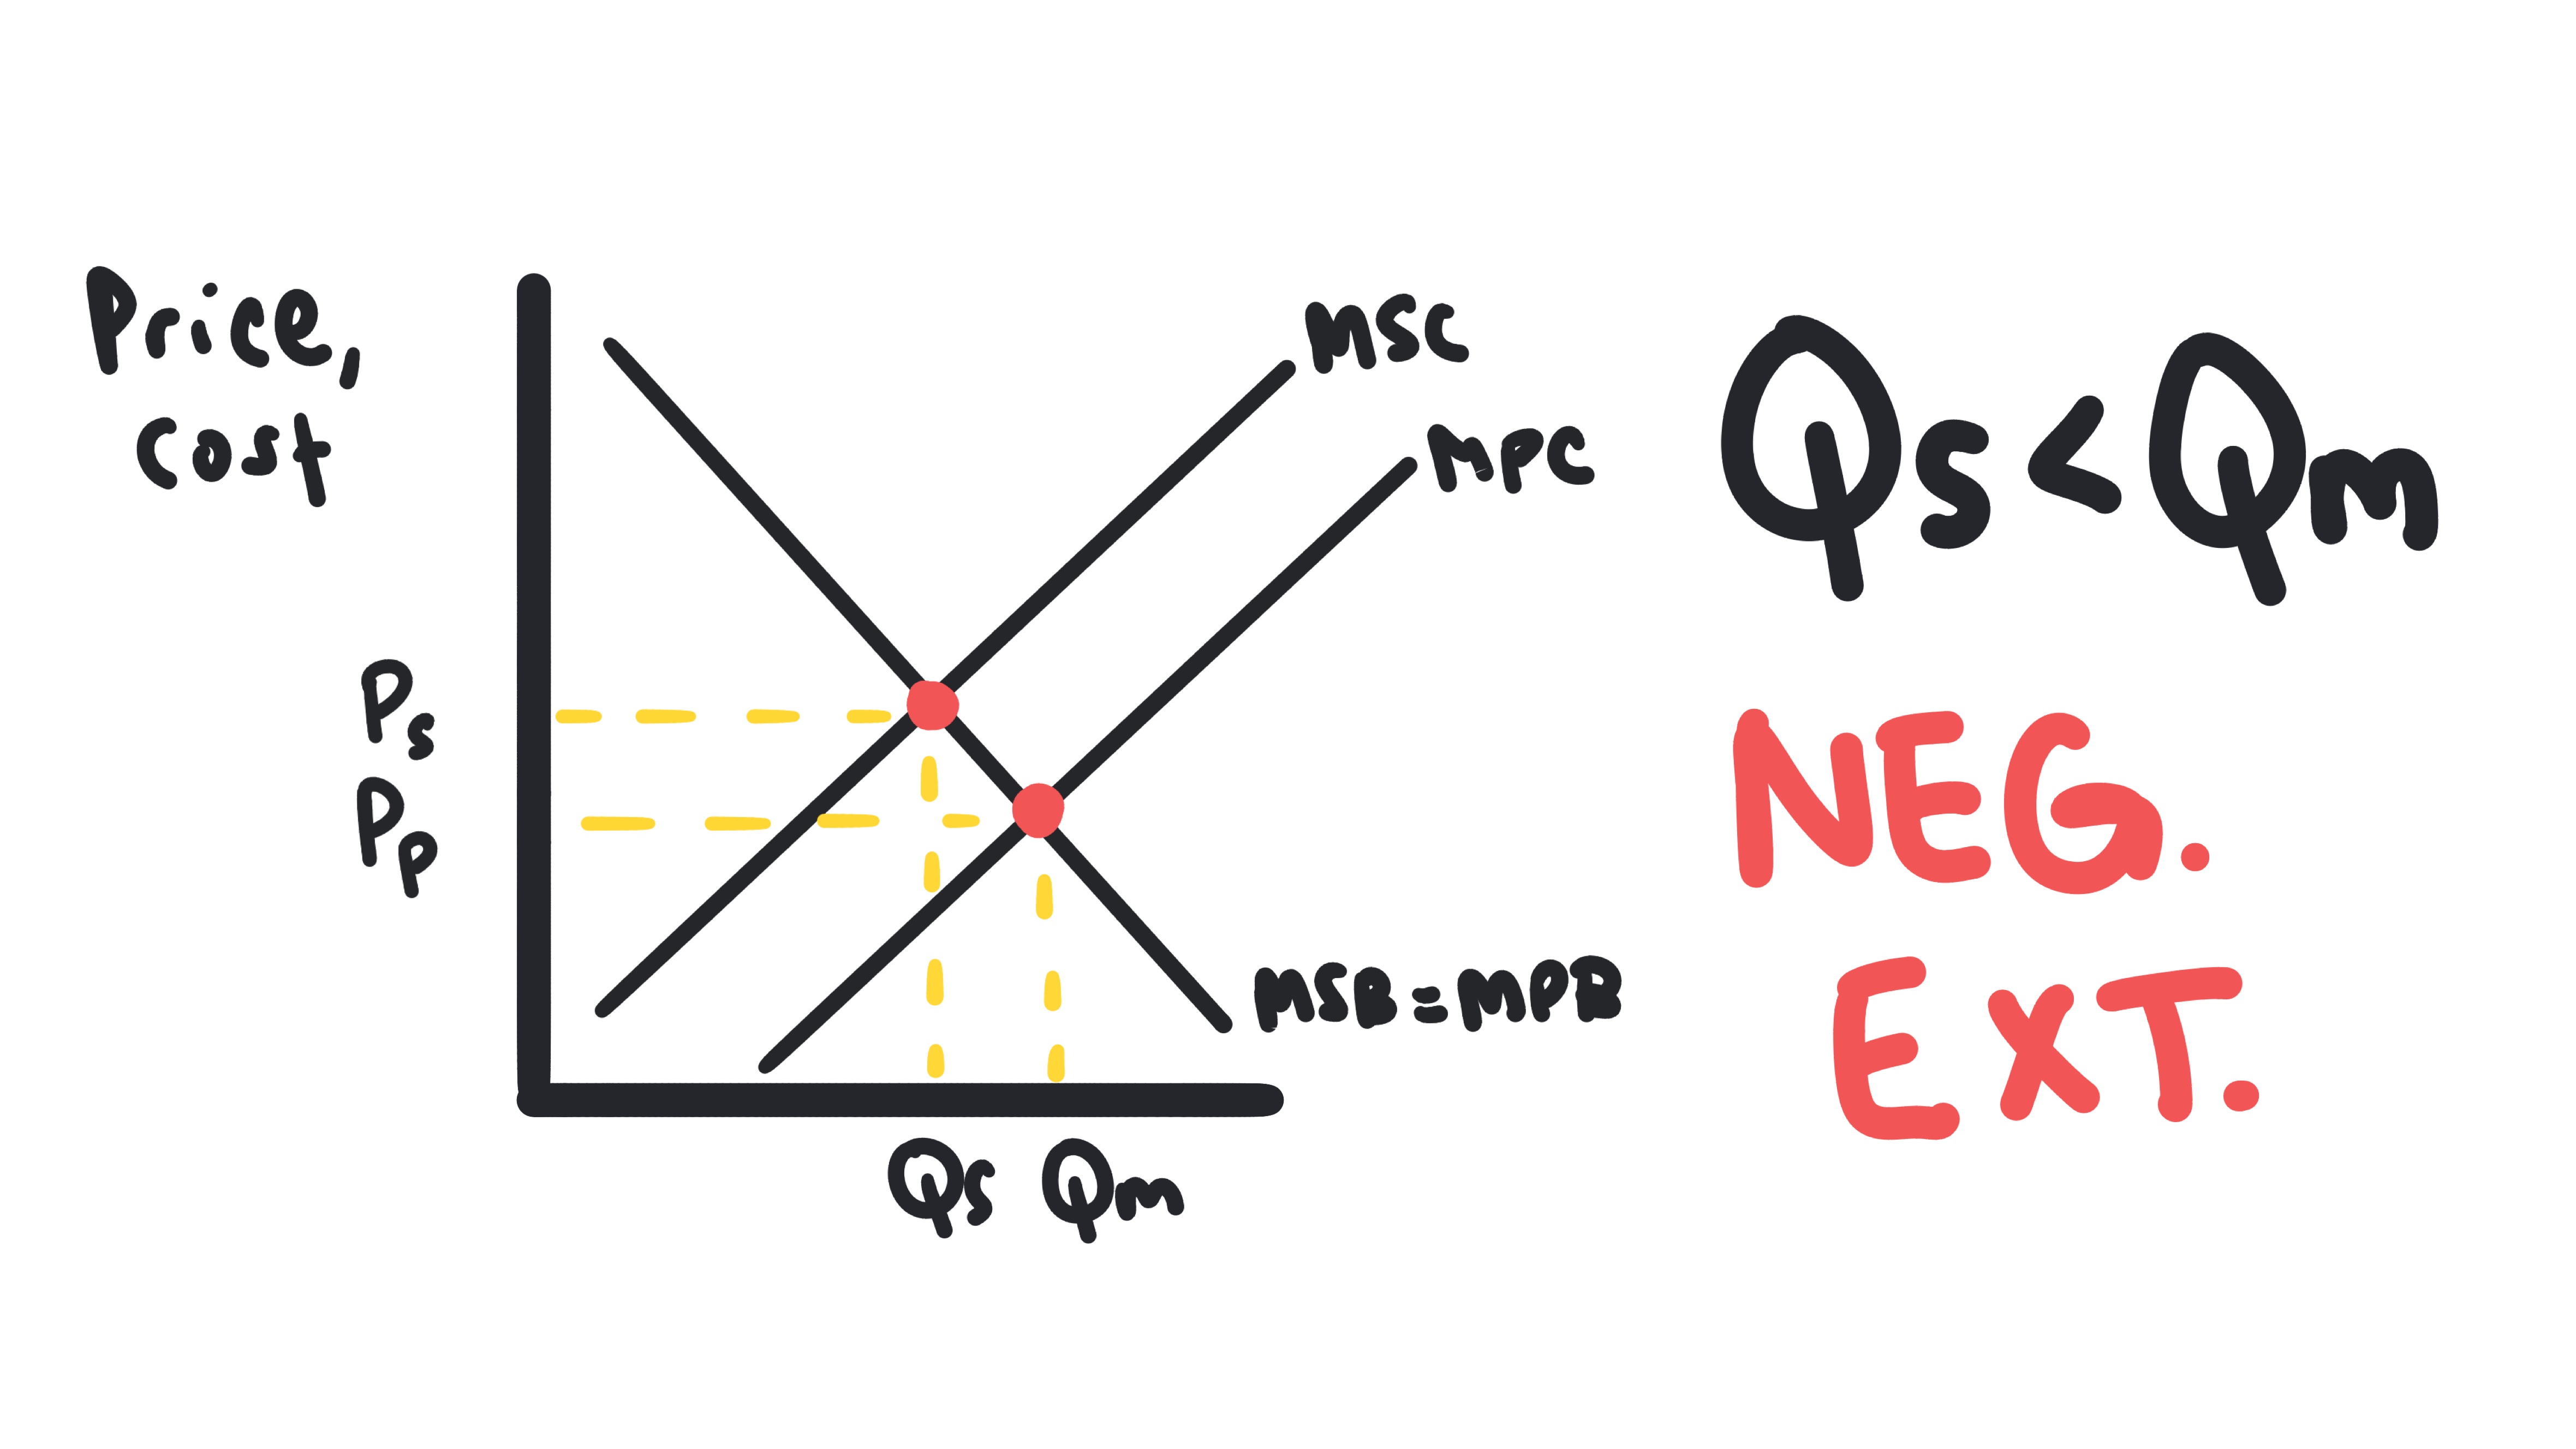
In a free market, the factory only cares about its own bank account (MPC). Because they ignore the MEC, they produce at a quantity where MPC intersects Demand (which represents MSB, Marginal Social Benefit). This results in overproduction.
Society wants Qs (where MSC = MSB), but the market gives us Qm.
How to Fix It: The Tax Debate
To fix this over-allocation of resources, the government must discourage production. They have two main types of taxes in their toolkit, but only one actually works for this problem.
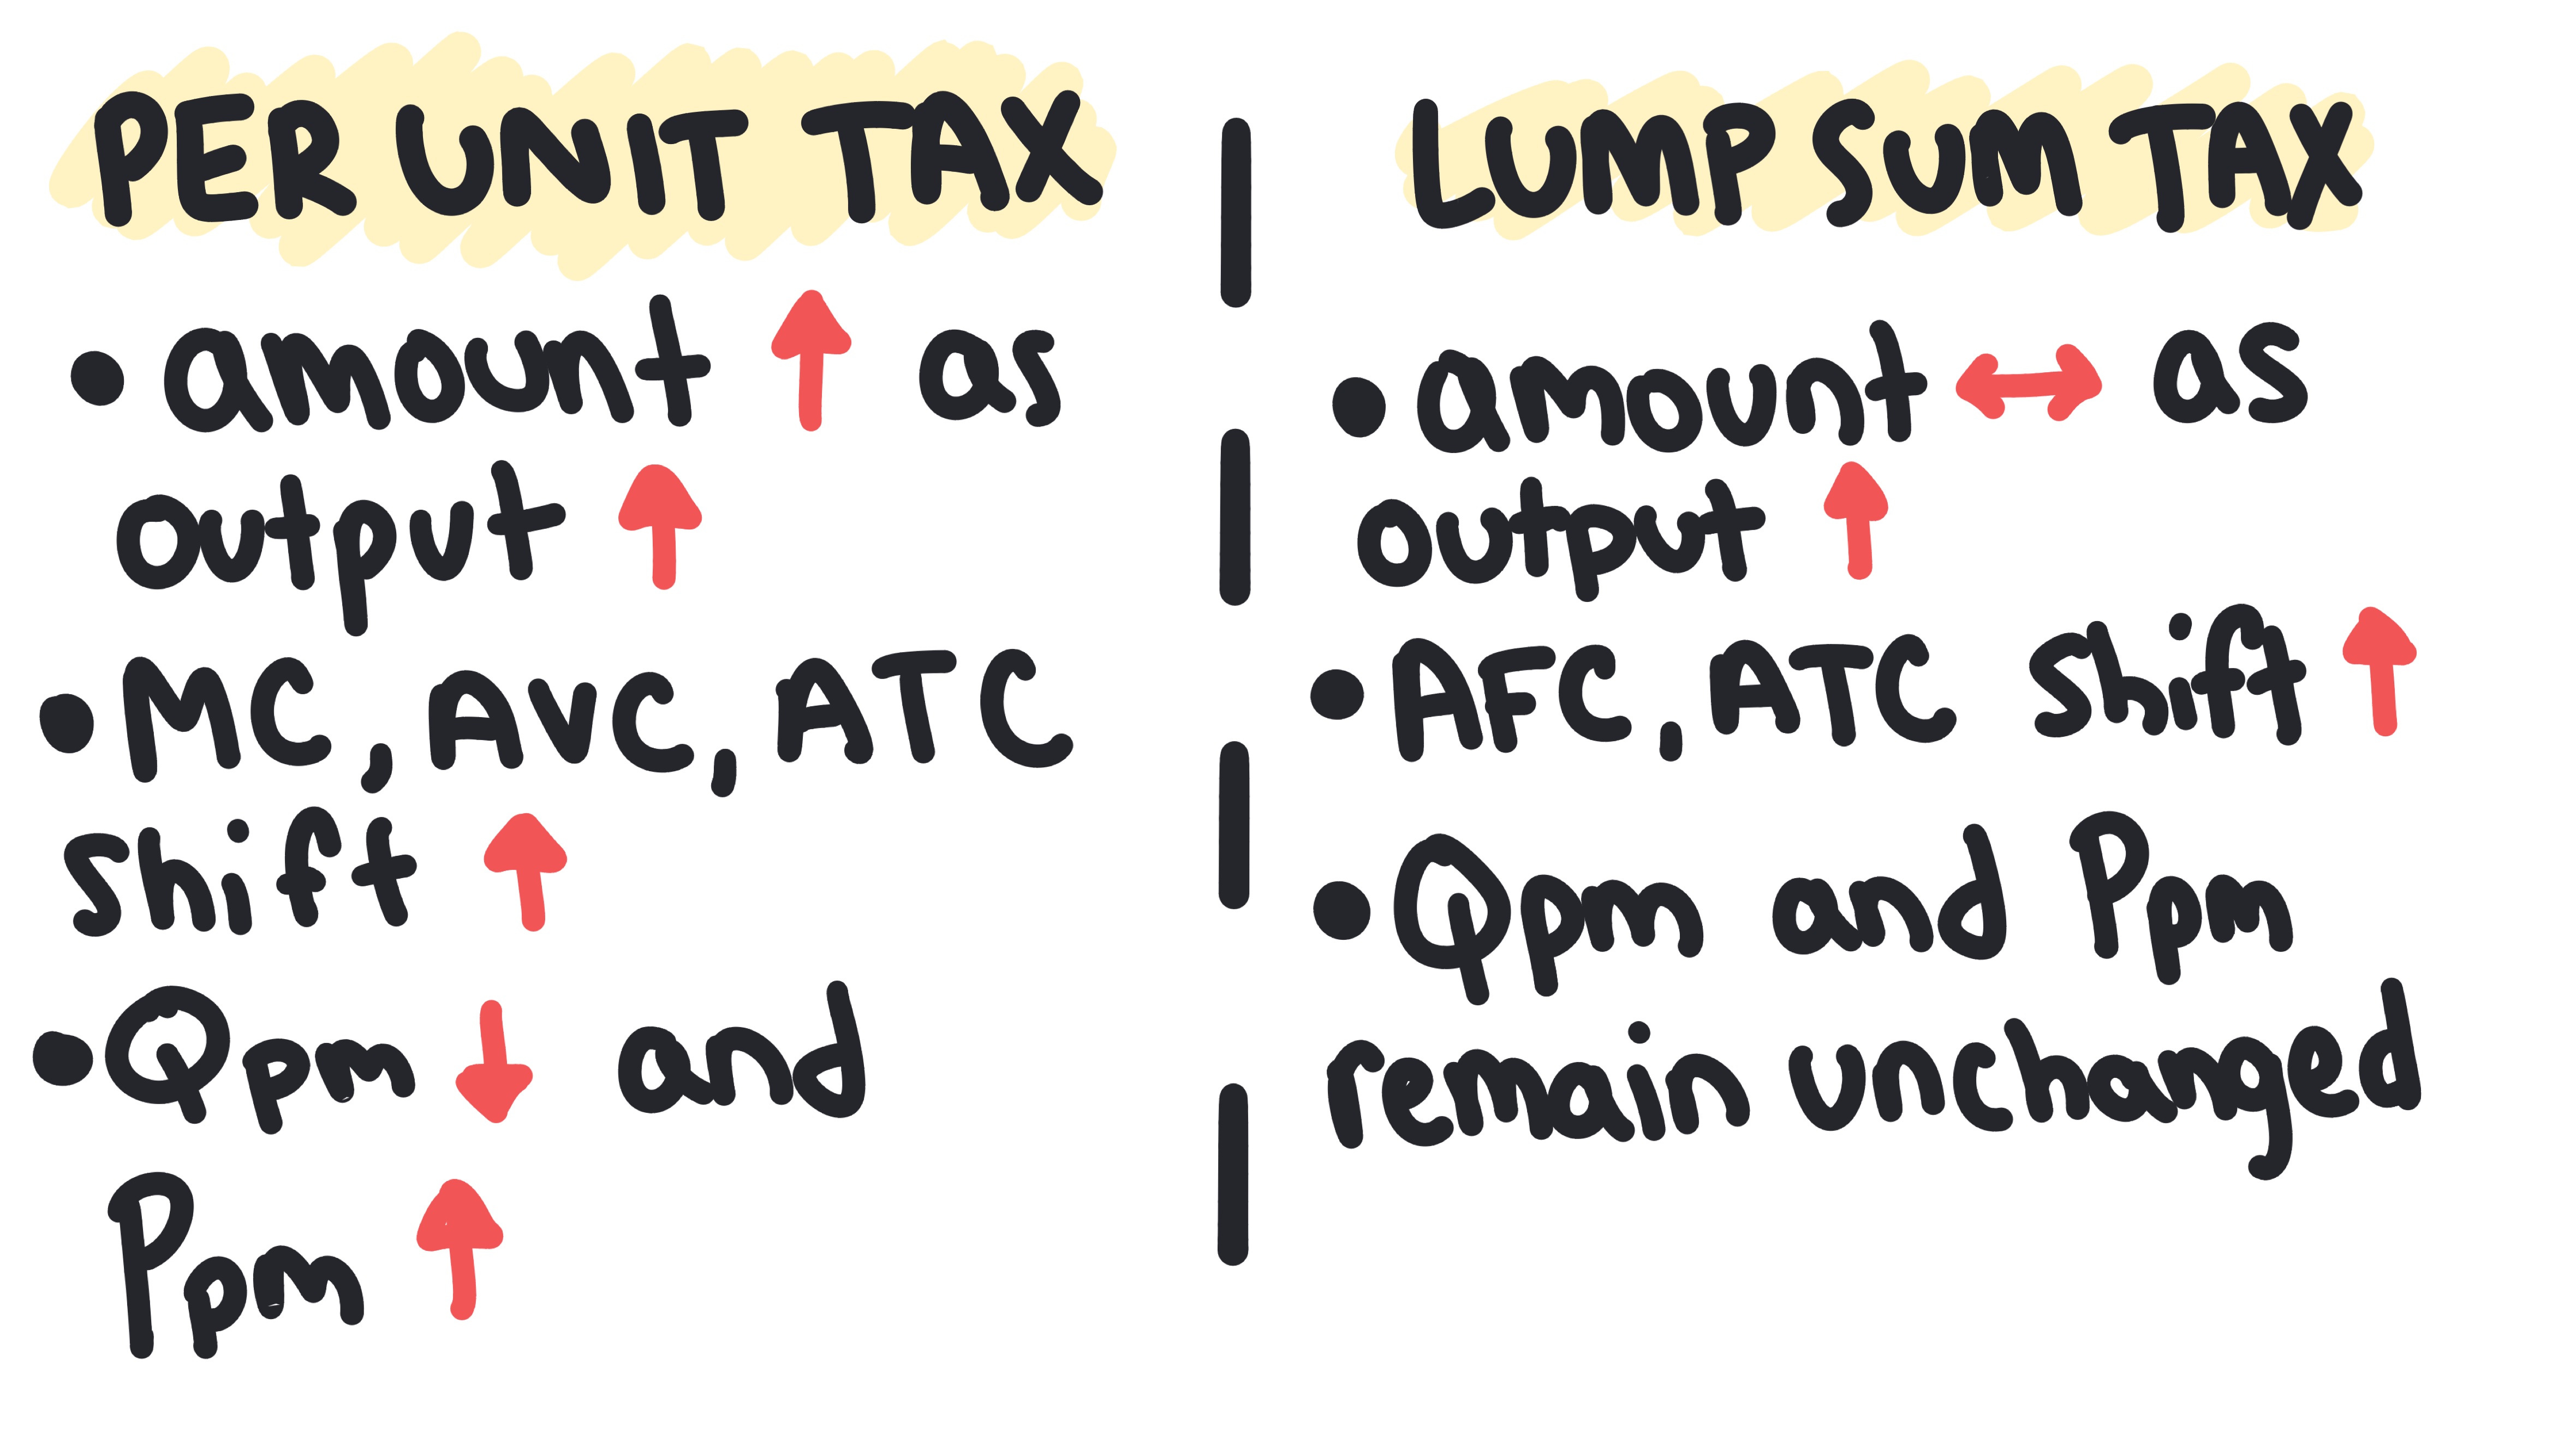
1. The Per-Unit Tax (The Corrective Tool)
A Per-Unit Tax is a tax charged on every single item produced (for example, $5 per gallon of chemical waste).
Why it works: Because the tax is tied to production levels, it increases the Marginal Cost for the firm.
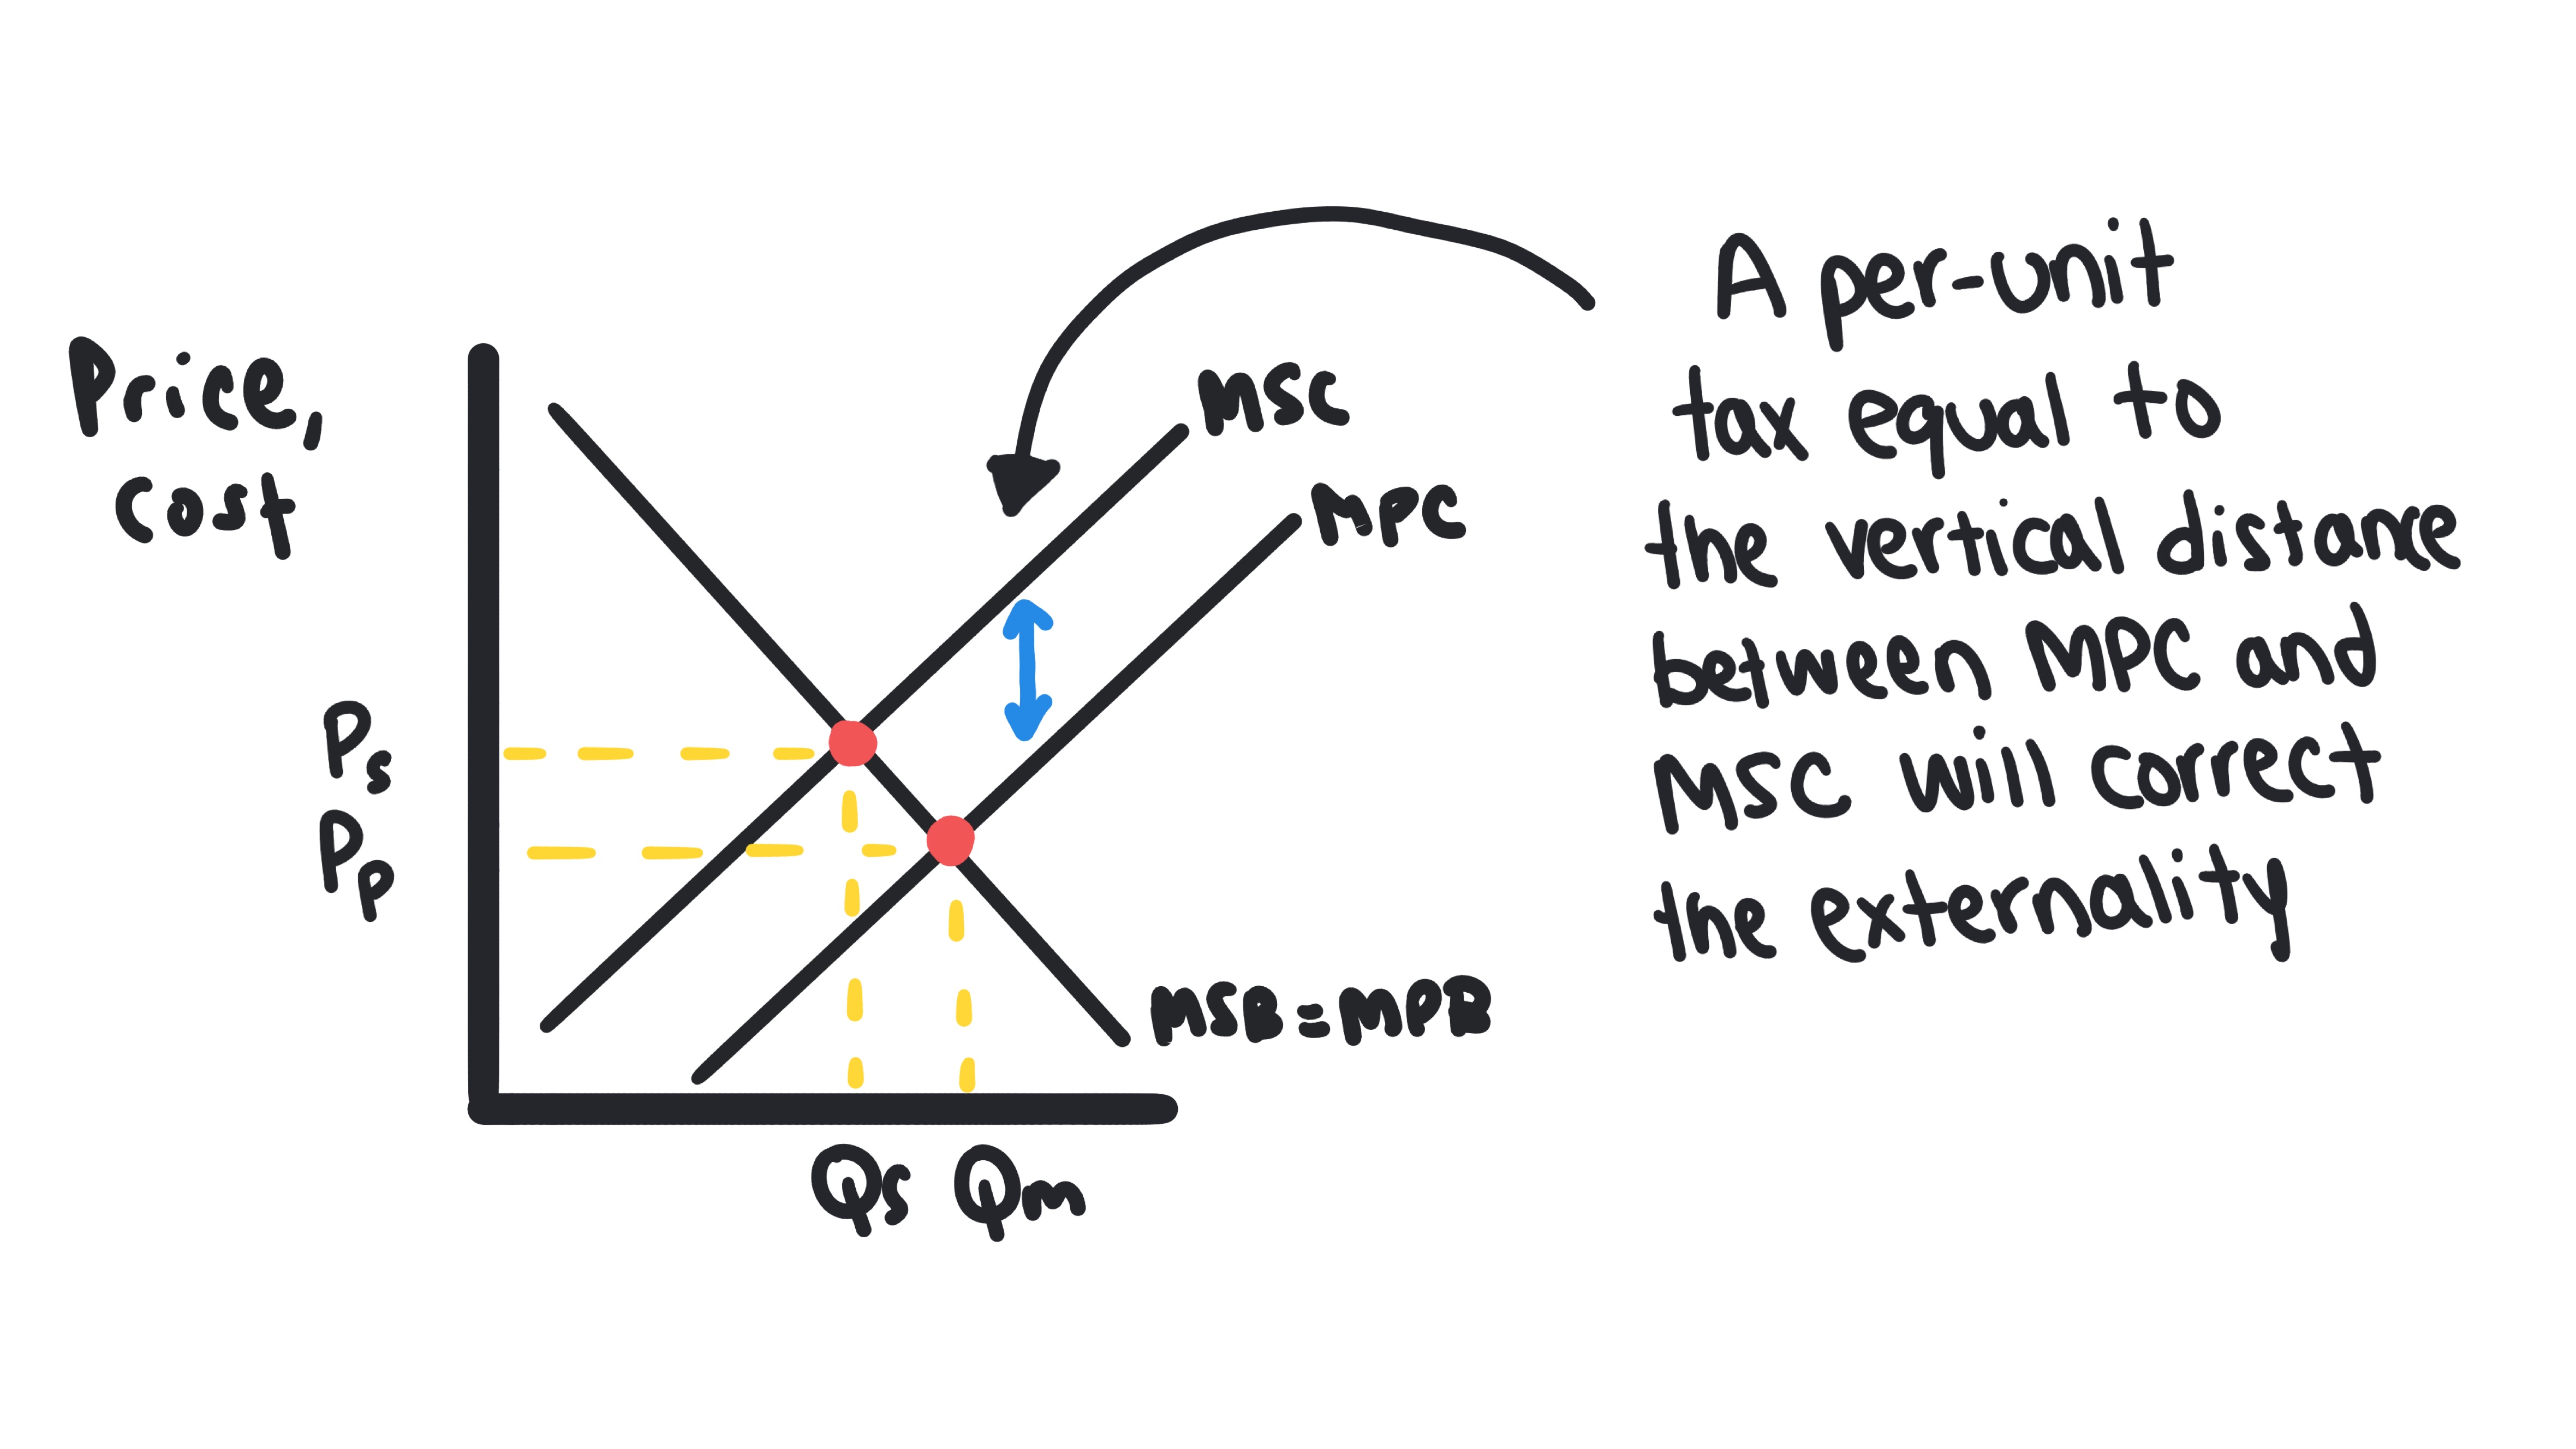
The graph: This shifts the MPC curve upward. If the tax is set exactly equal to the MEC, the new MPC will sit right on top of the MSC curve.
The outcome: The firm's profit-maximizing point (MR = MC) shifts left. They produce less, the price rises, and the Deadweight Loss is eliminated.
2. The Lump-Sum Tax (The Ineffective Tool)
A Lump-Sum Tax is a one-time, fixed fee (for example, a $10,000 annual "pollution permit").
Why it fails: In microeconomics, we know that Fixed Costs do not affect Marginal Cost (MC).
The logic: Since MC doesn't change, the firm's decision on how much to produce (MR = MC) doesn't change either.
The outcome: The firm writes a check to the government, but they keep dumping the exact same amount of chemicals into the stream. The market failure remains.
The Dojo Summary
- Per-Unit Taxes change Marginal Cost, change Quantity, and fix Externalities.
- Lump-Sum Taxes change Fixed Cost, change Profit, but do not change Quantity or fix the market failure.
Analogy: A Per-Unit Tax is like a "pay-as-you-pollute" meter—it changes your behavior every minute. A Lump-Sum Tax is like a parking ticket you've already decided to pay; it's annoying, but it won't change how you drive today.
Stop Reading. Start Drawing.
Try the Graph Gym challenge right here.
Graph Gym Challenge
Draw a market with a negative production externality (like pollution). Label MPC, MSC, Qm, Qs, and shade the deadweight loss area. Show how a per-unit tax equal to the marginal external cost can restore the social optimum.
Join the Dojo to Access Graph Gym
Unlock unlimited Graph Gym challenges, Dojo Drills, and more with a Season Pass.
Learn MoreInstructions
Draw a market with a negative production externality (like pollution).
To Do:
- Label the market quantity (Qm)
- Label the socially optimal quantity (Qs)
- Show the MSC curve above the MPC curve
- Shade the deadweight loss area
Check Your Understanding
Question 1 of 3
The presence of a negative externality in production leads to a market outcome where: