Unit 6 - Market Failure and the Role of Government
Table of Contents
Built into this unit
Flashcards
34 cards mix graphs, formulas, and key terms. Shuffle blends every type so you drill the whole unit—not just one format.
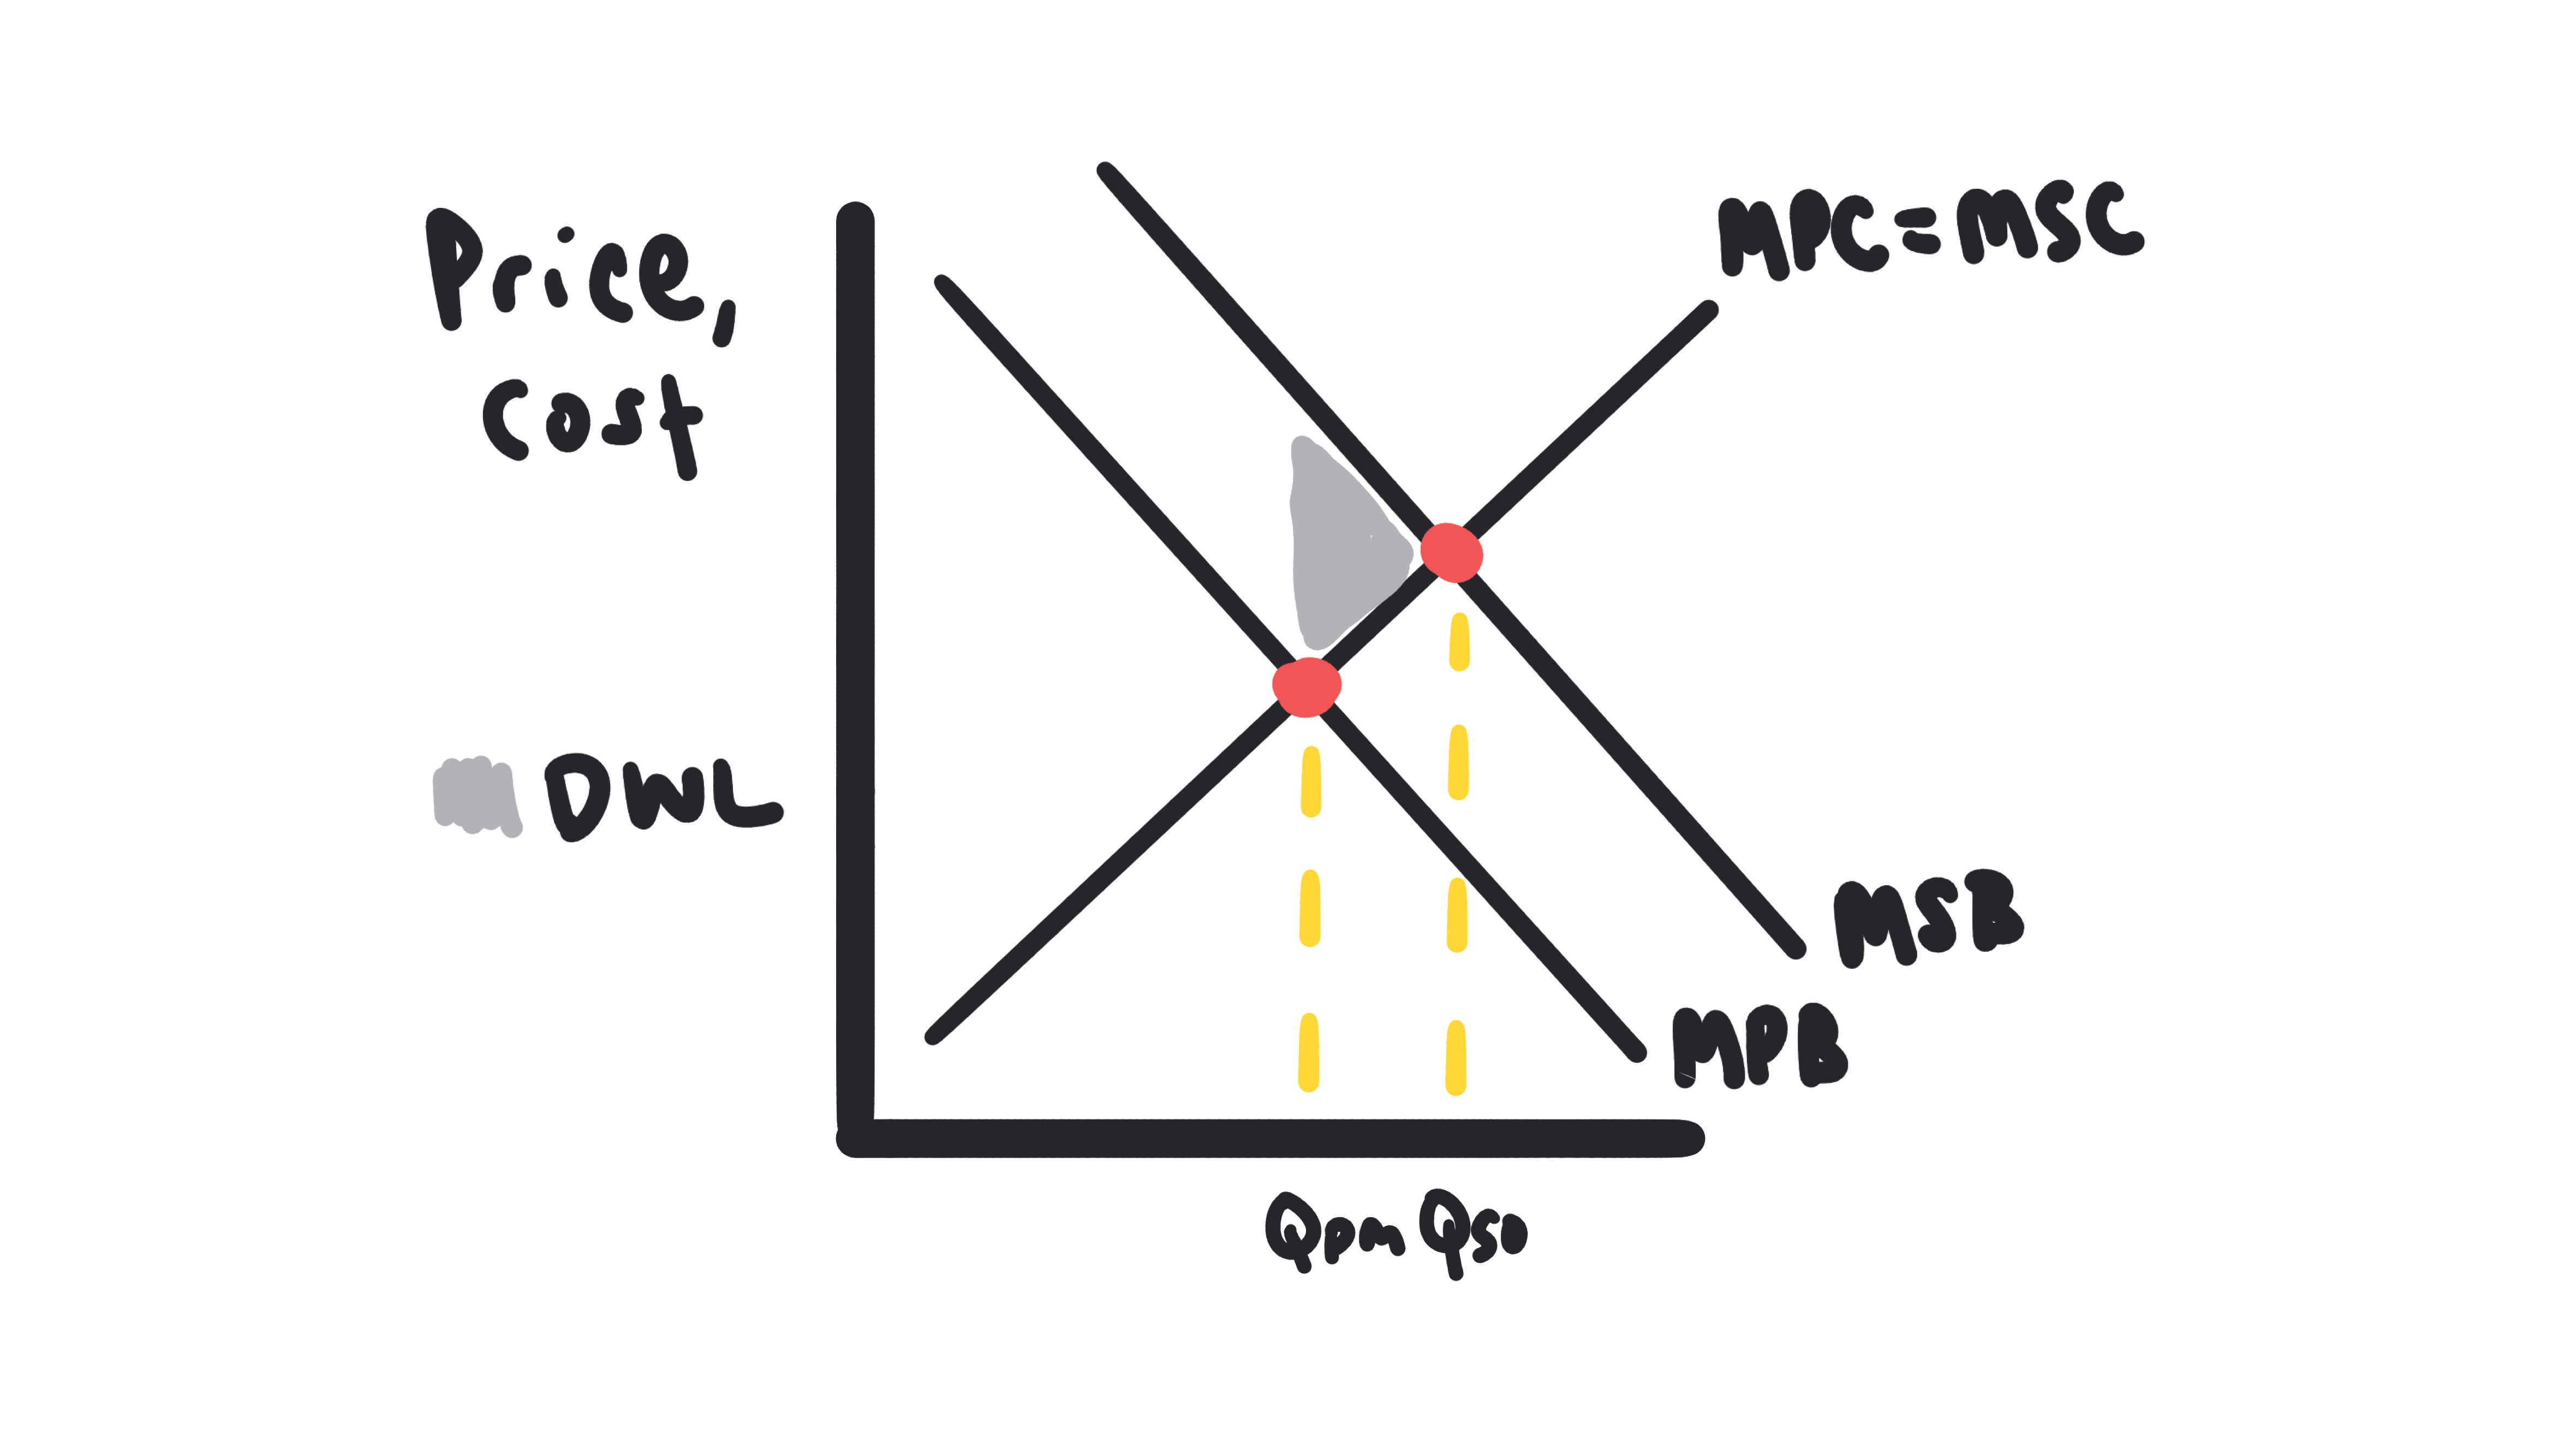
6.1 - Socially Efficient and Inefficient Market Outcomes
Socially Efficient and Inefficient Market Outcomes
Learn about socially efficient outcomes, deadweight loss, and when markets fail to allocate resources efficiently.
Key Terms & Definitions
Market Failure
A situation where the free market fails to satisfy society’s wants or allocates resources inefficiently.
- •The private market outcome does not equal the socially optimal outcome.
- •Result: The government must intervene to fix the inefficiency.
6.2 - Externalities
Externalities
Learn about positive and negative externalities, marginal social benefit and cost, and corrective policies.
Key Terms & Definitions
Externality
A third-party cost or benefit resulting from a transaction between a buyer and a seller.
- •Can be positive (benefit) or negative (cost).
- •Causes the market to fail because the private decision-makers do not consider these external effects.
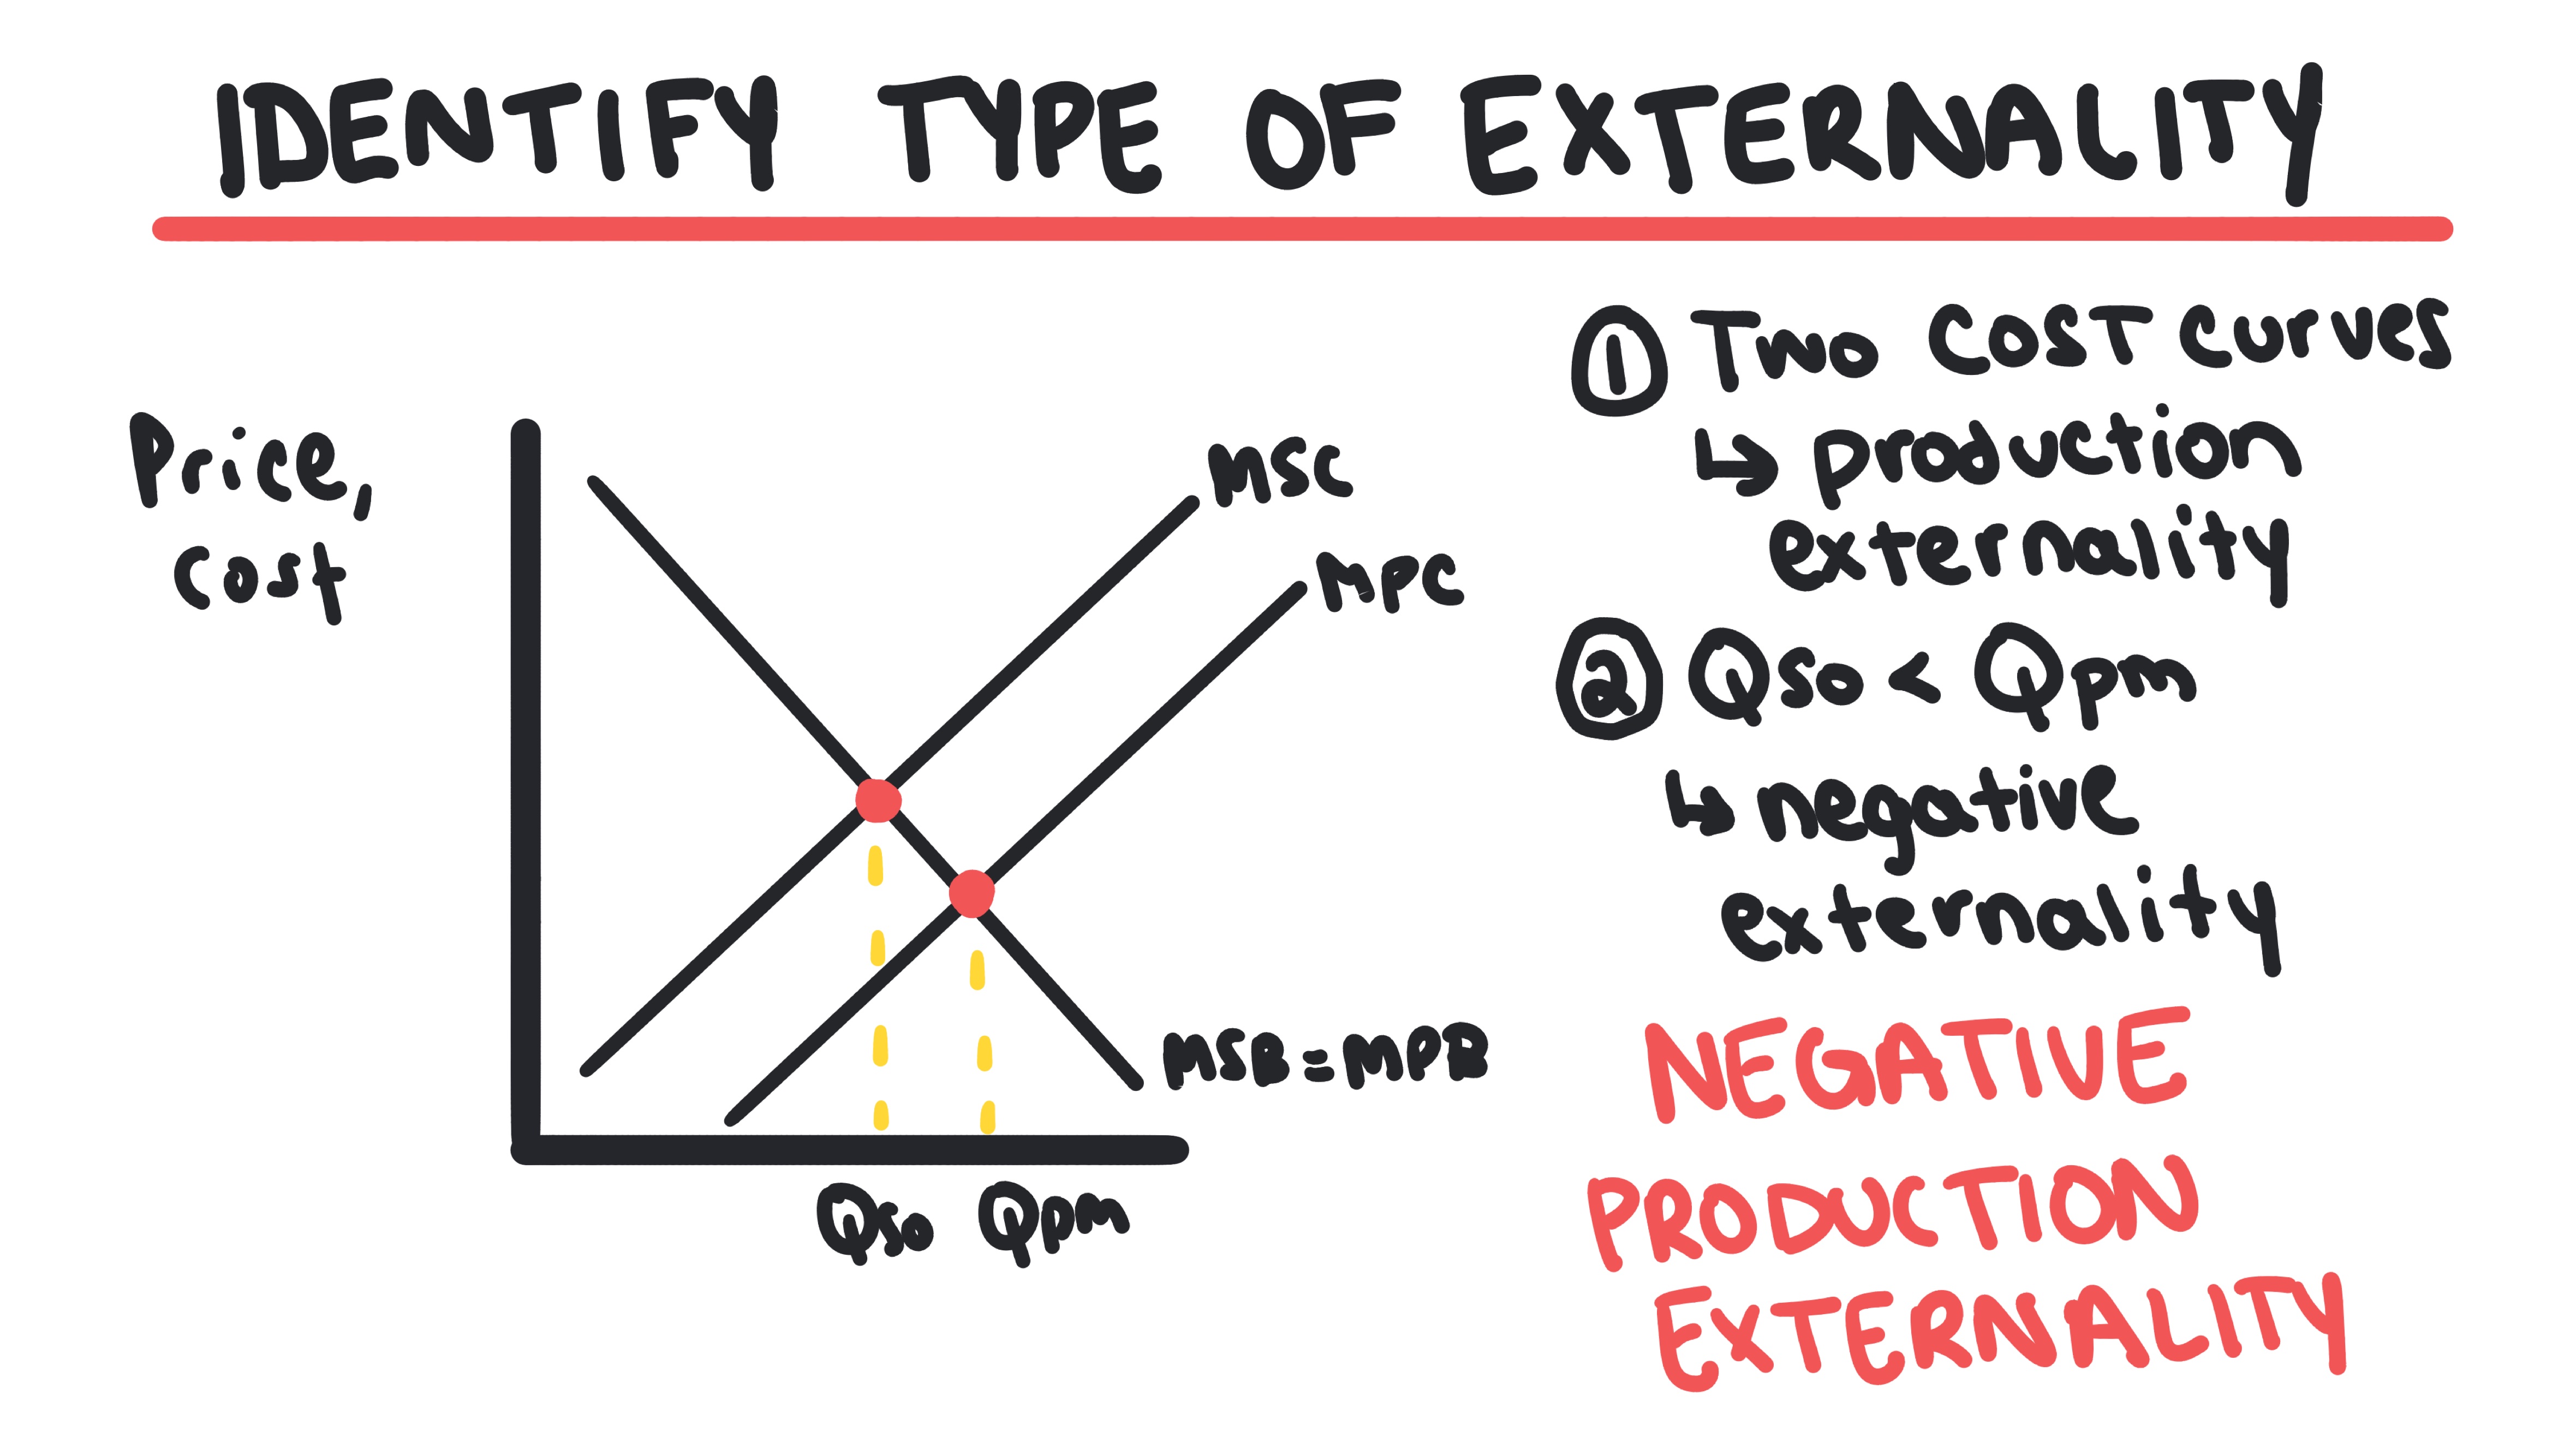
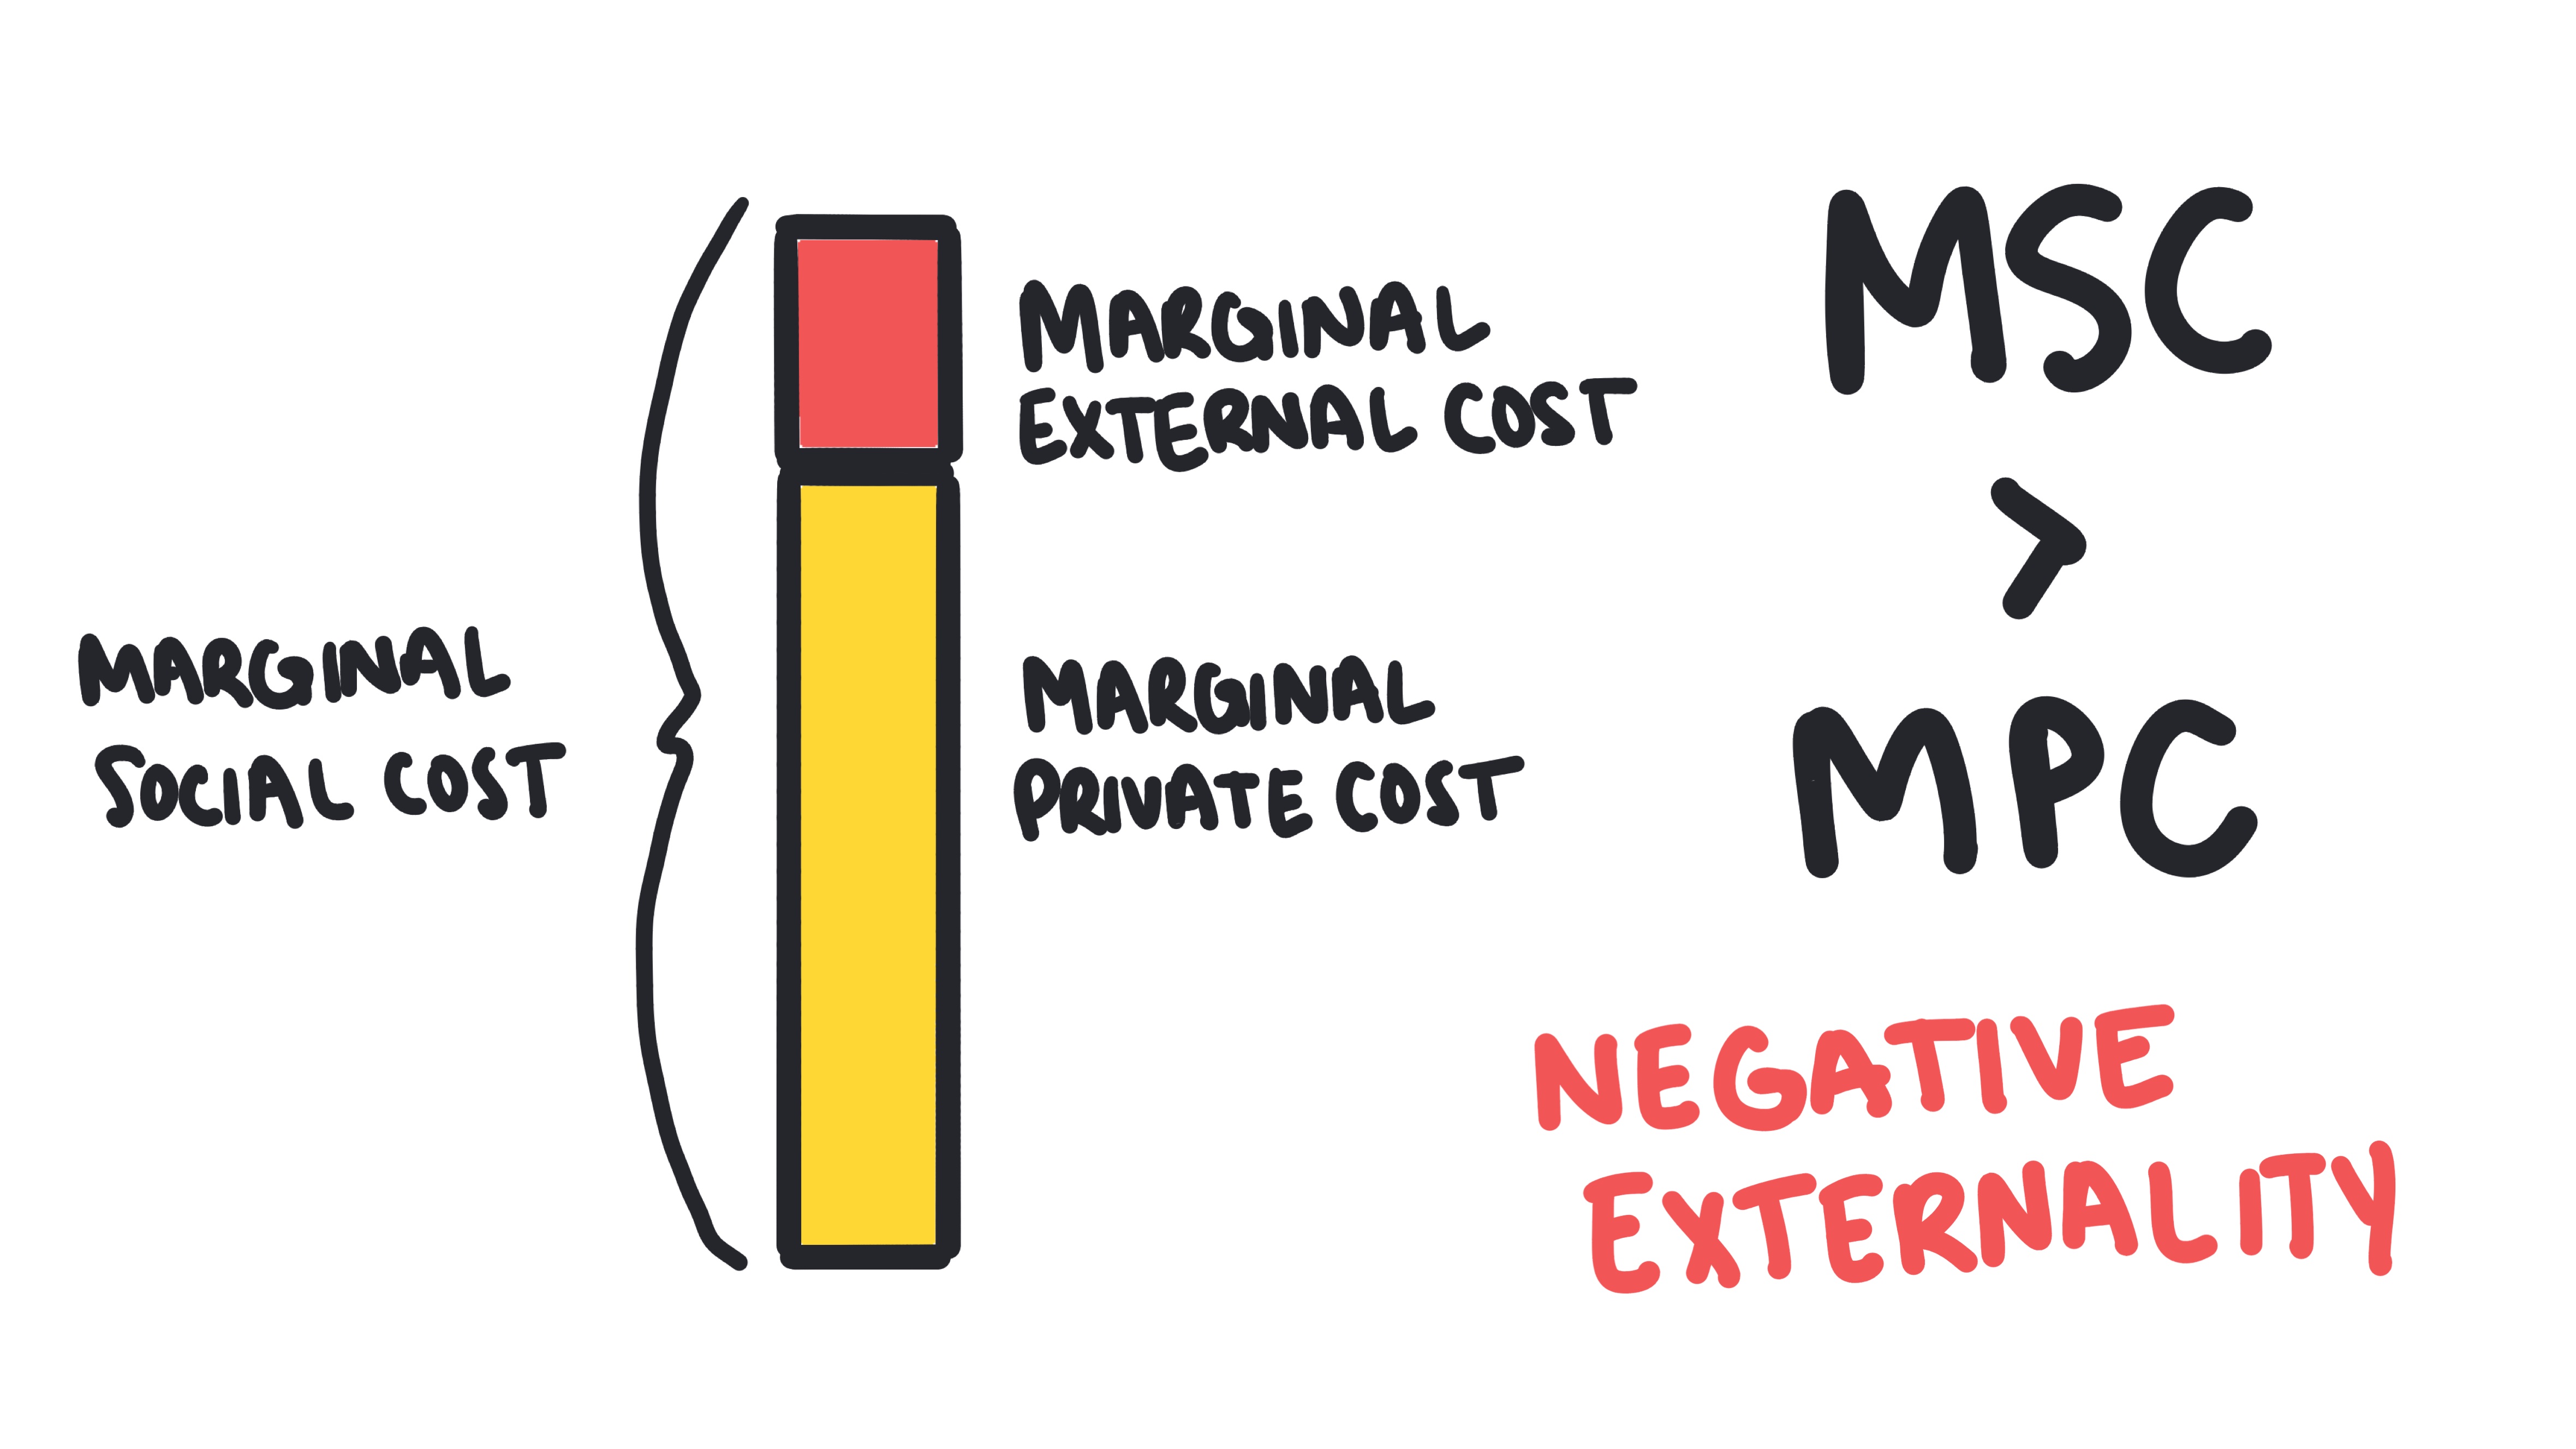
Negative Externality
A situation where production or consumption imposes a cost on a third party (e.g., pollution, smoking).
- •Marginal Social Cost (MSC) > Marginal Private Cost (MPC).
- •The market Overproduces (Q_market > Q_social).
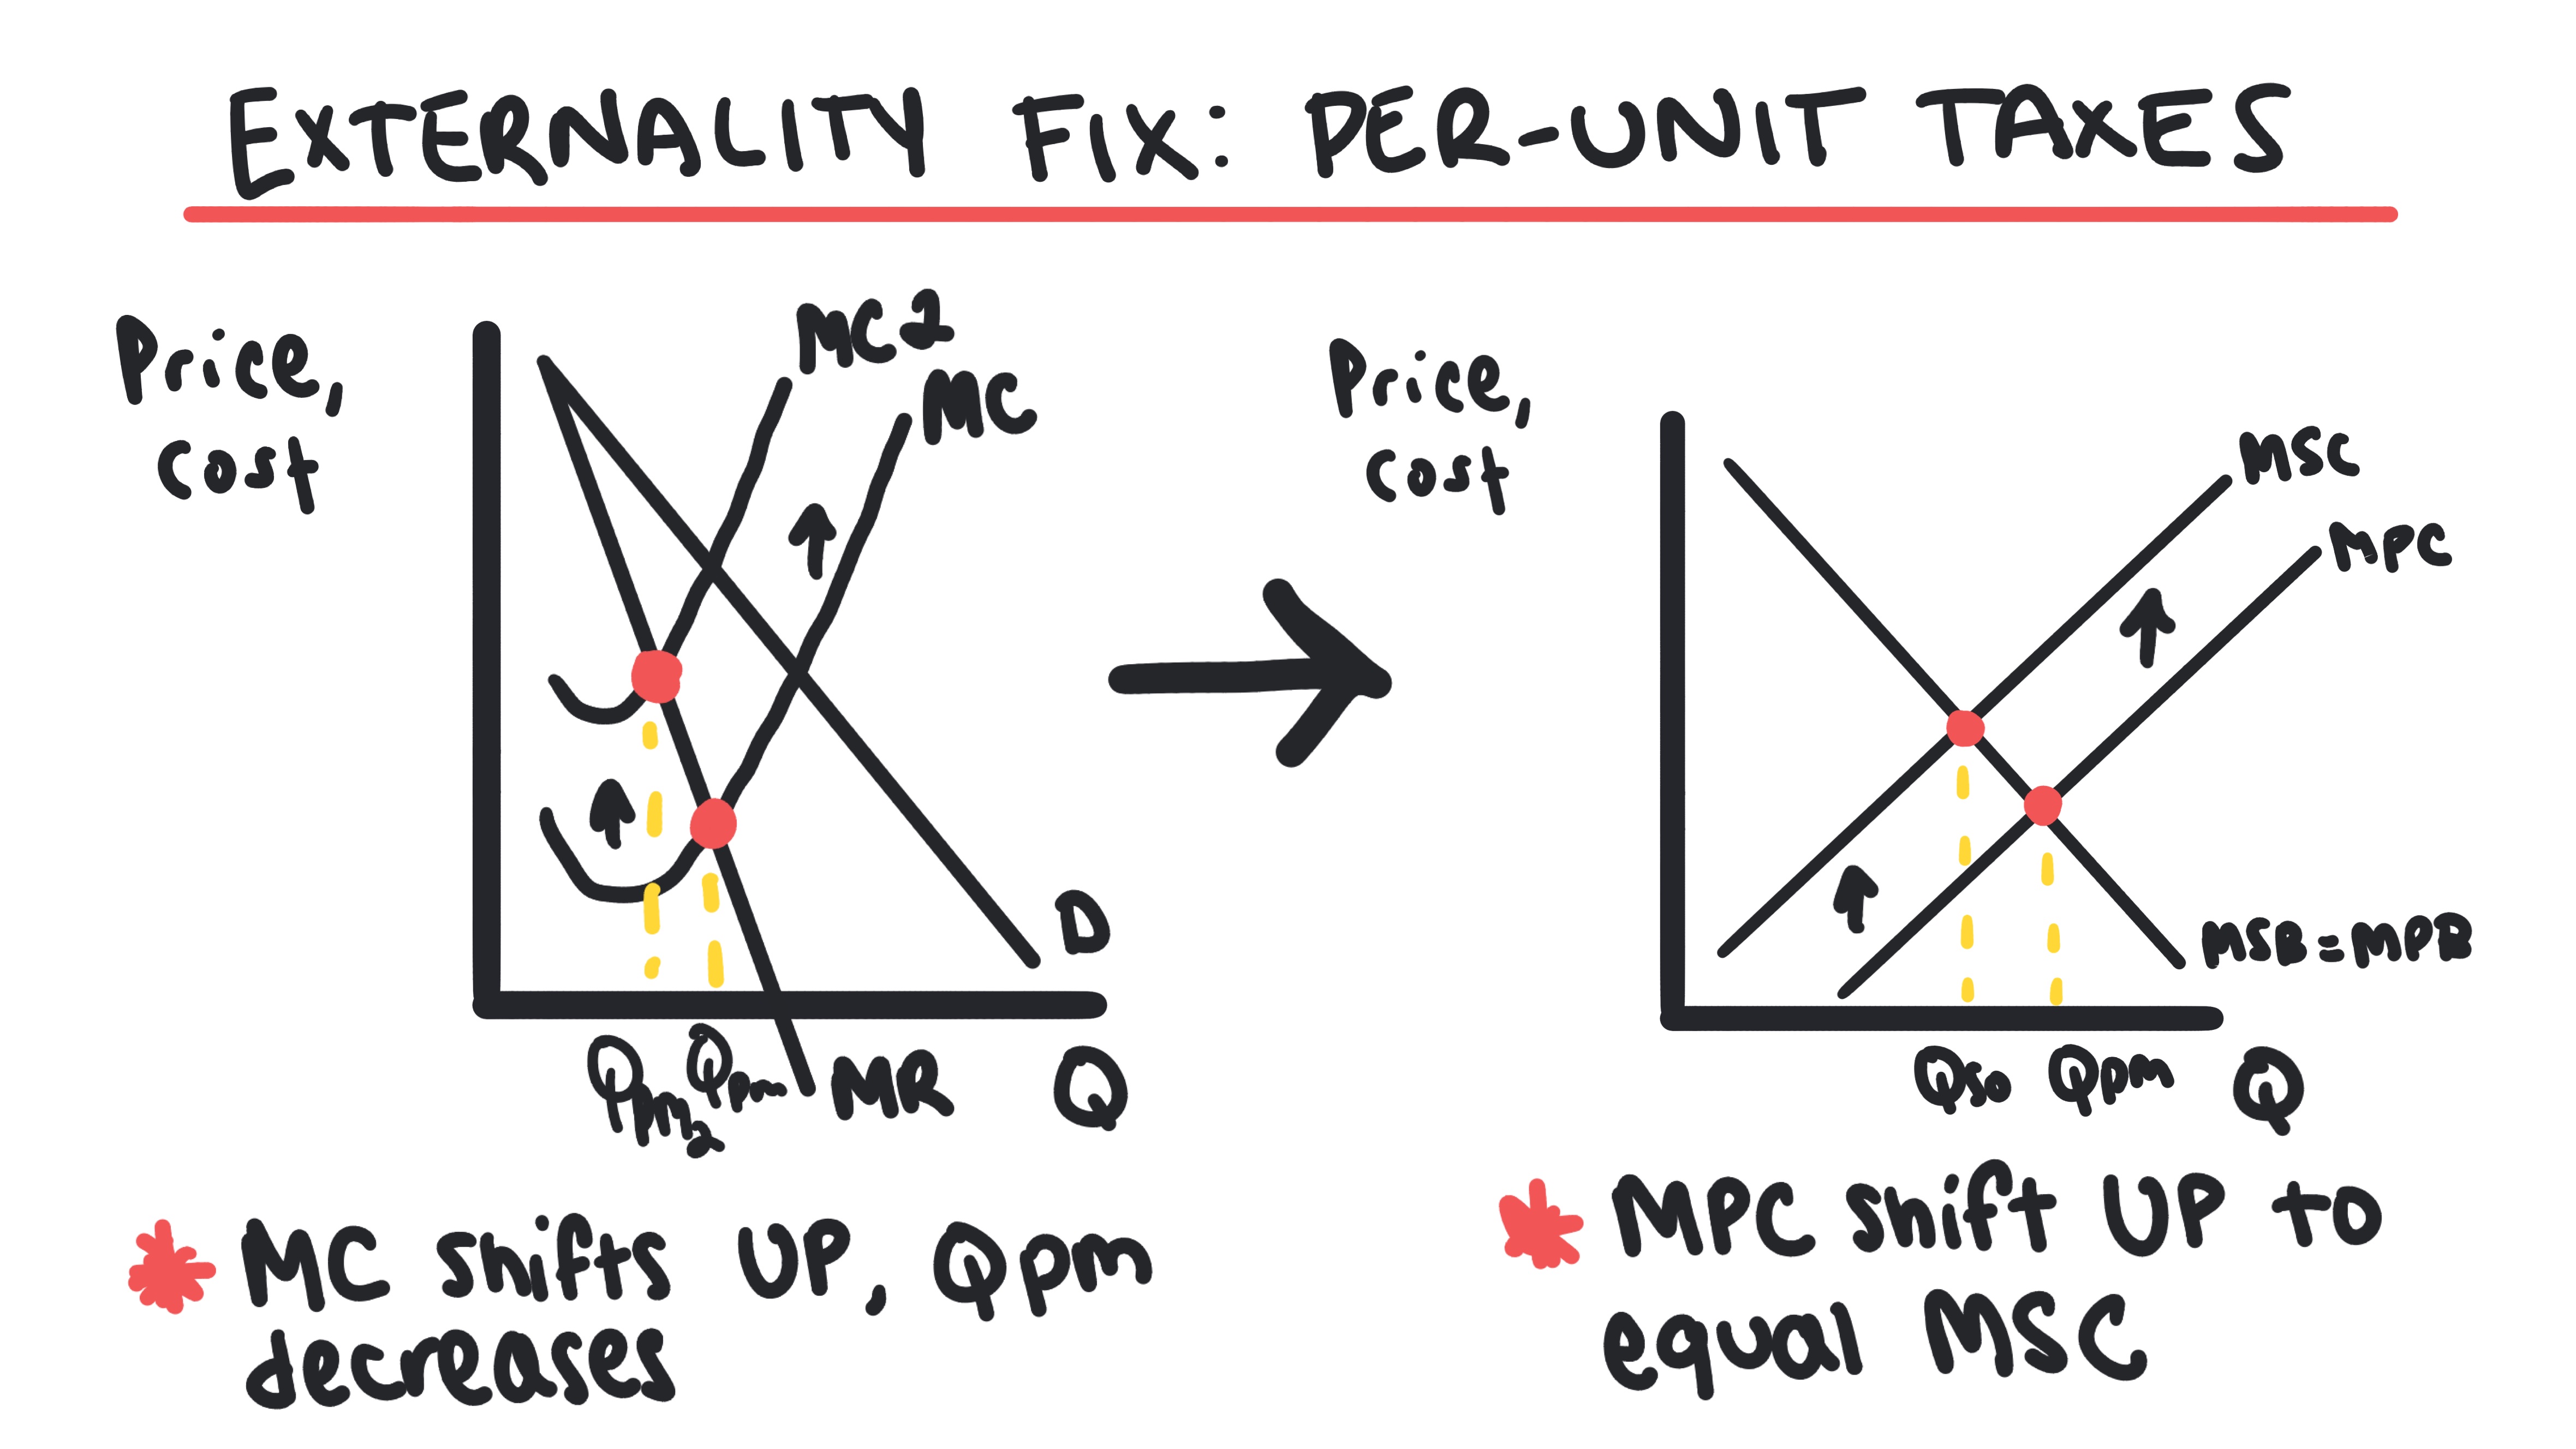
- •Fix: Per-unit Tax.
Positive Externality
A situation where production or consumption creates a benefit for a third party (e.g., vaccines, education).
- •Marginal Social Benefit (MSB) > Marginal Private Benefit (MPB).
- •The market Underproduces (Q_market < Q_social).
- •Fix: Per-unit Subsidy.
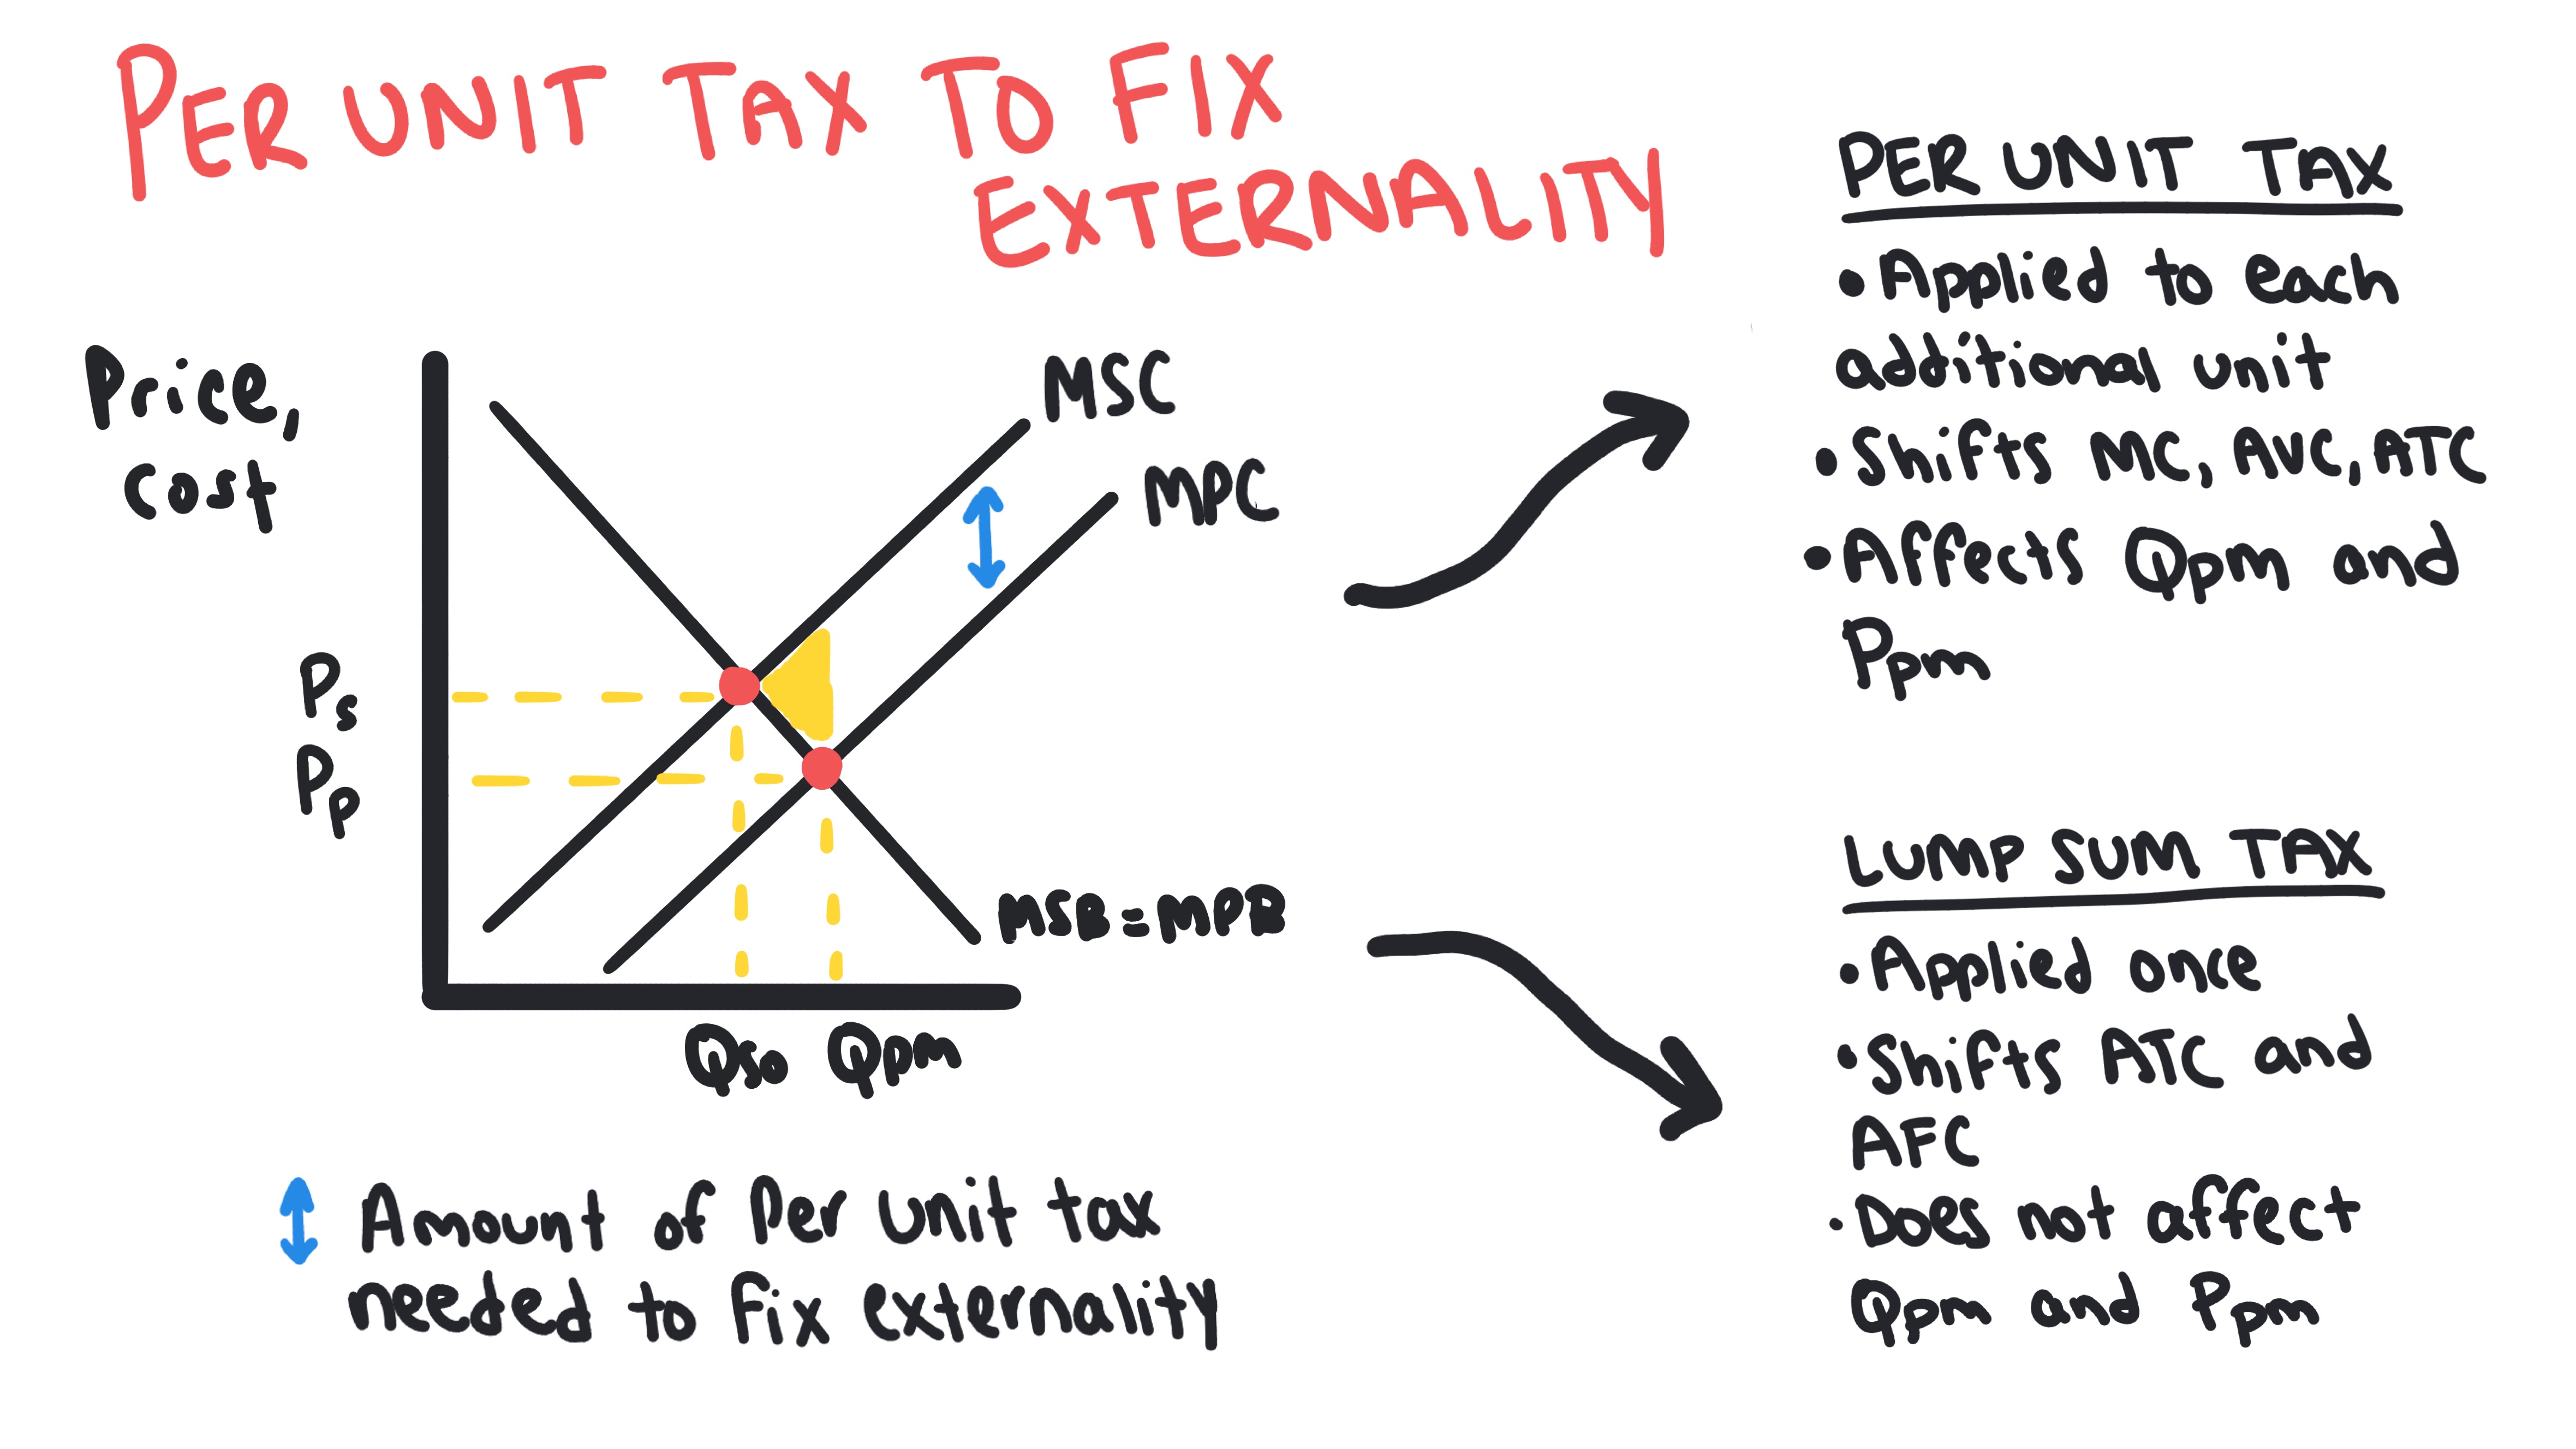
Per-Unit Taxes and Subsidies
Government tools used to correct externalities by shifting the private cost or benefit curves.
- •Taxing a negative externality shifts MPC up to meet MSC.
- •Subsidizing a positive externality shifts MPB up to meet MSB.
Whiteboards
6.3 - Public and Private Goods
Public and Private Goods
Learn the characteristics of public and private goods, free riders, and why markets underprovide public goods.
Key Terms & Definitions
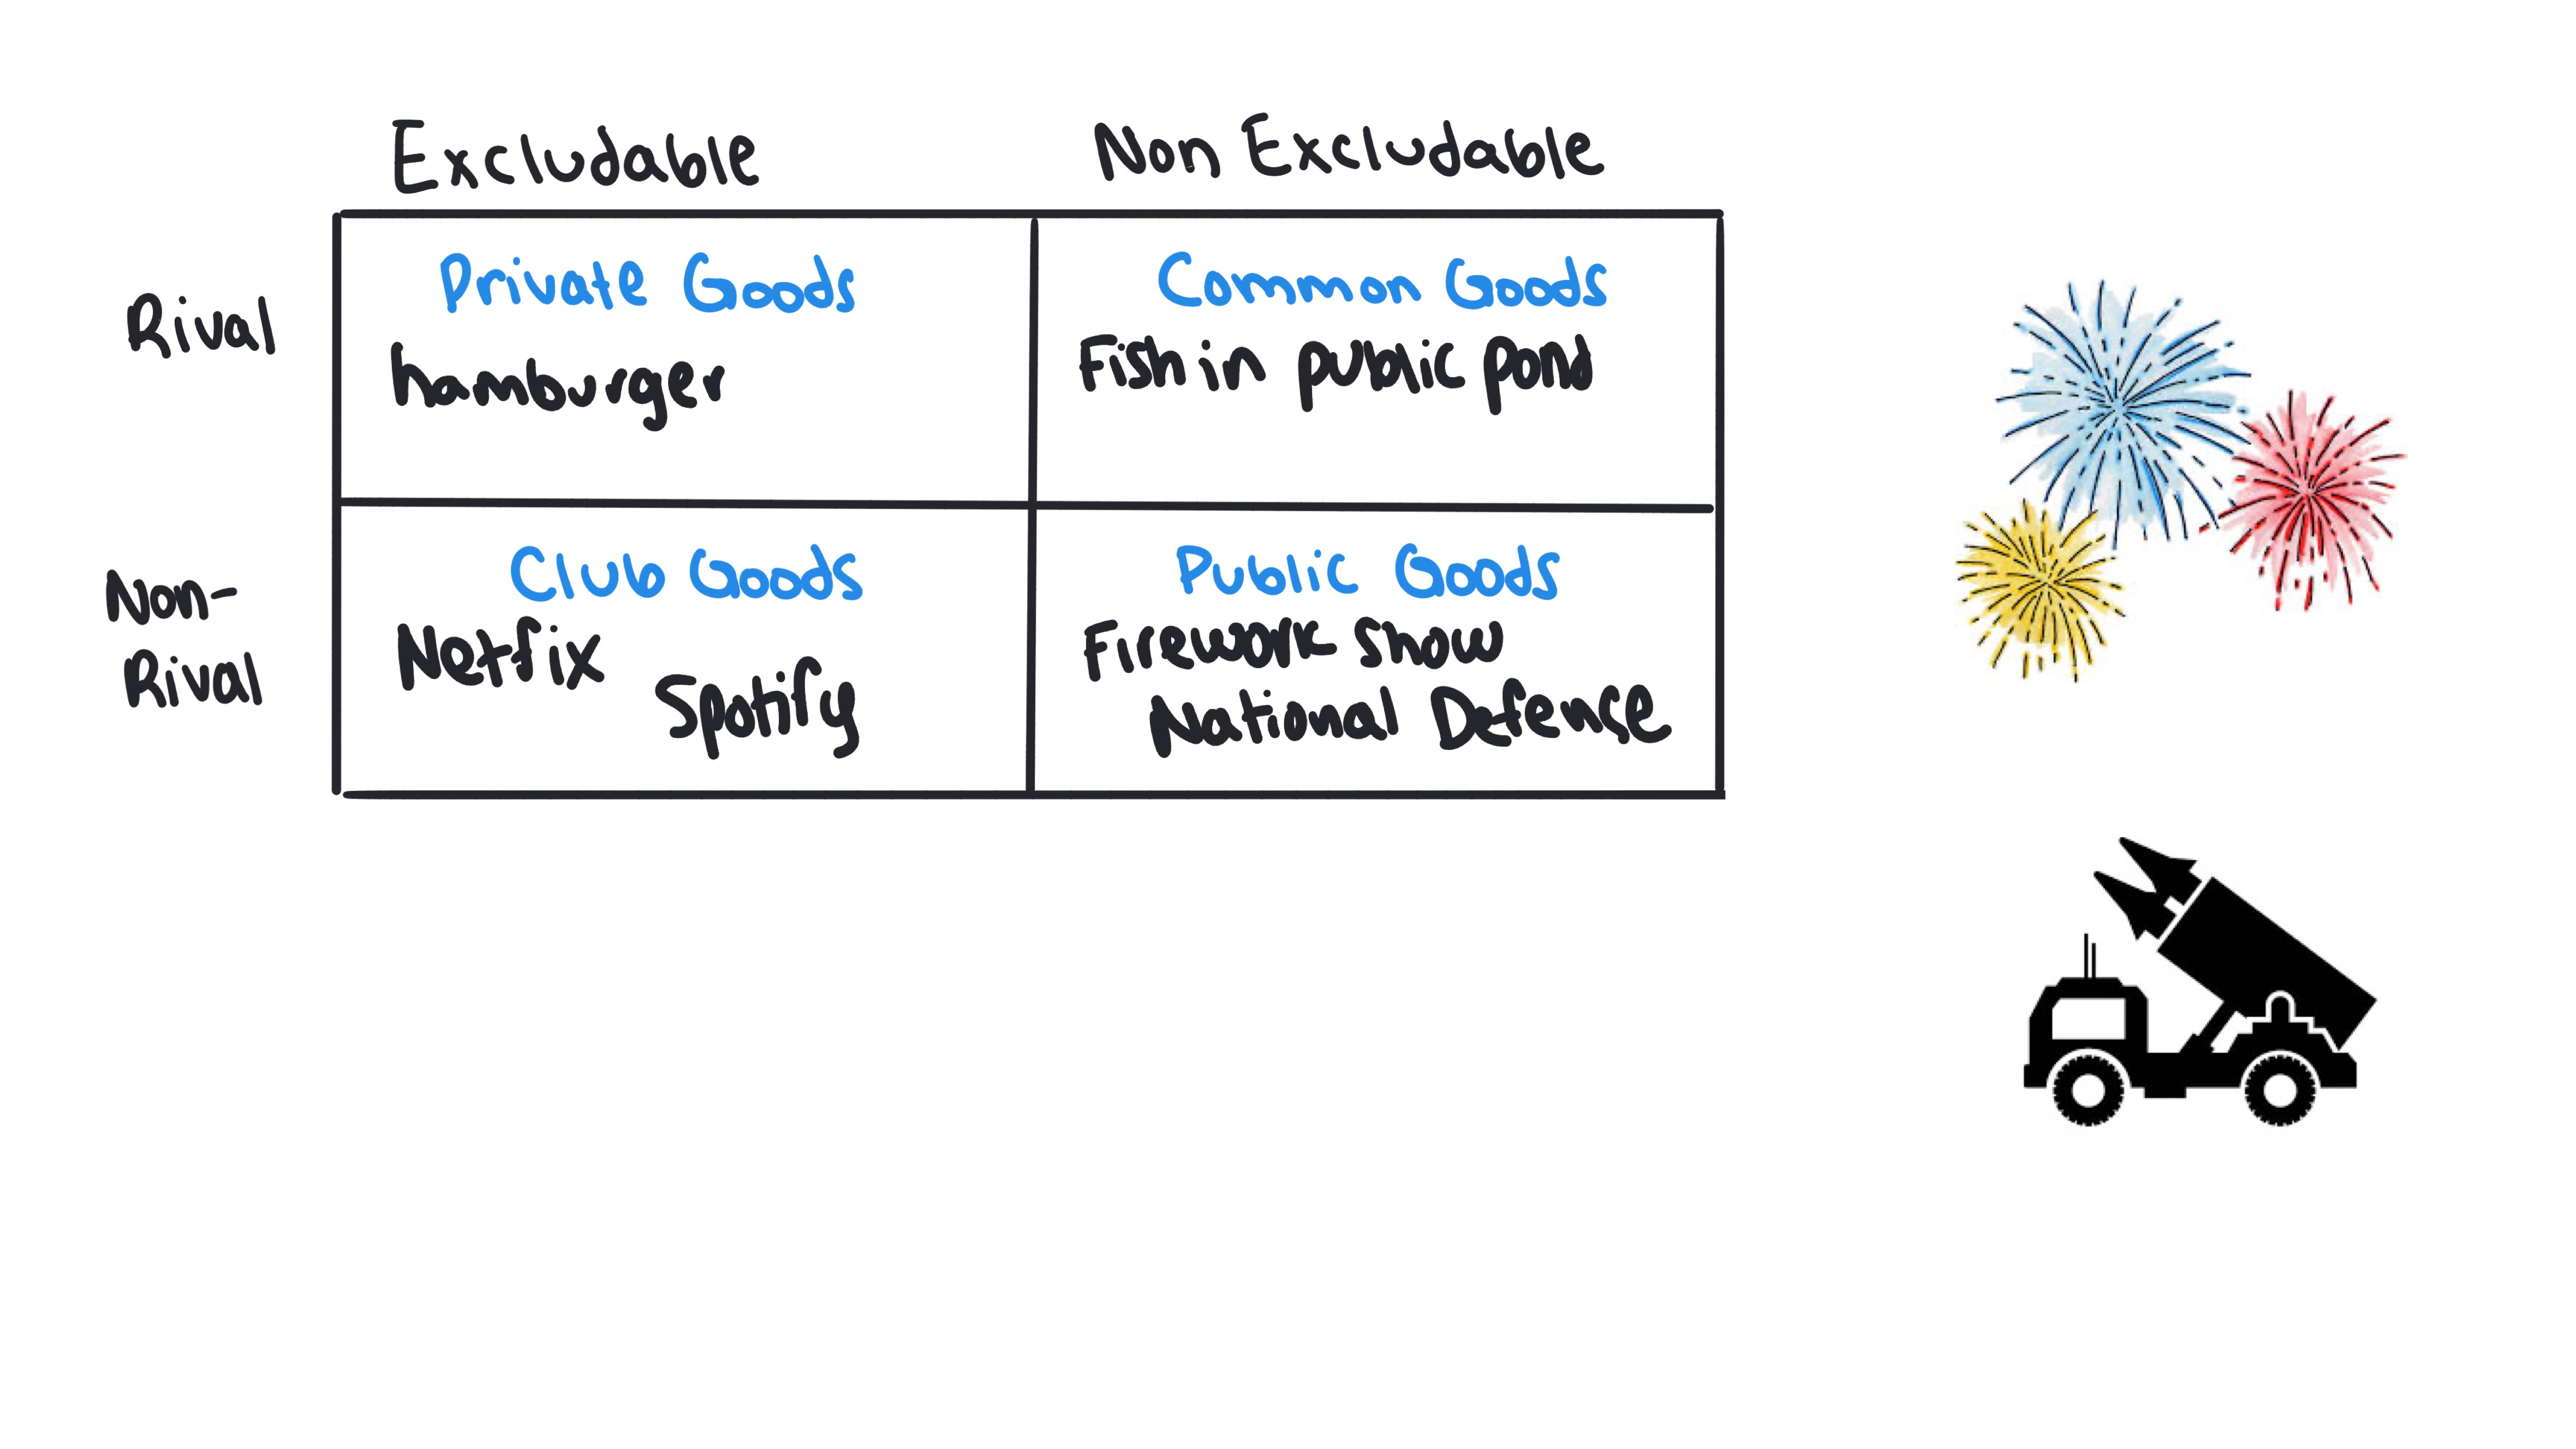
Public Good
A good that is both non-excludable and non-rival in consumption.
- •Examples: National defense, public parks, streetlights.
- •The free market tends to underproduce these due to the Free Rider Problem.
Non-Excludable
A characteristic of a good where it is impossible (or very costly) to prevent people who haven't paid from using it.
- •Example: You can't stop someone from enjoying the light from a streetlight.
Free Rider Problem
An issue where individuals benefit from a public good without paying for it, leading to underproduction by private firms.
- •Since firms cannot profit from free riders, the government must provide the good using tax revenue.
Whiteboards
6.4 - The Effects of Government Intervention in Different Market Structures
The Effects of Government Intervention in Different Market Structures
Learn how taxes, subsidies, and regulation affect outcomes in different market structures.
Key Terms & Definitions
Antitrust Laws
Legislation designed to prevent monopolies and promote competition.
- •Used to break up monopolies or stop mergers that would hurt consumers.
- •Example: The Sherman Antitrust Act.
Per-Unit Taxes and Subsidies
Government tools used to correct externalities by shifting the private cost or benefit curves.
- •Taxing a negative externality shifts MPC up to meet MSC.
- •Subsidizing a positive externality shifts MPB up to meet MSB.
Lump Sum vs. Per Unit
The distinction between one-time fixed interventions and variable interventions.
- •Lump Sum (Tax/Subsidy): Affects Fixed Costs. Changes Profit, but NOT Quantity or Price.
- •Per Unit (Tax/Subsidy): Affects Variable Costs (MC). Changes Profit, Quantity, AND Price.
Whiteboards
6.5 - Inequality
Inequality
Learn about income inequality, the Lorenz curve, and policies that address distributional outcomes.
Key Terms & Definitions
Income Inequality
The unequal distribution of household income across the population.
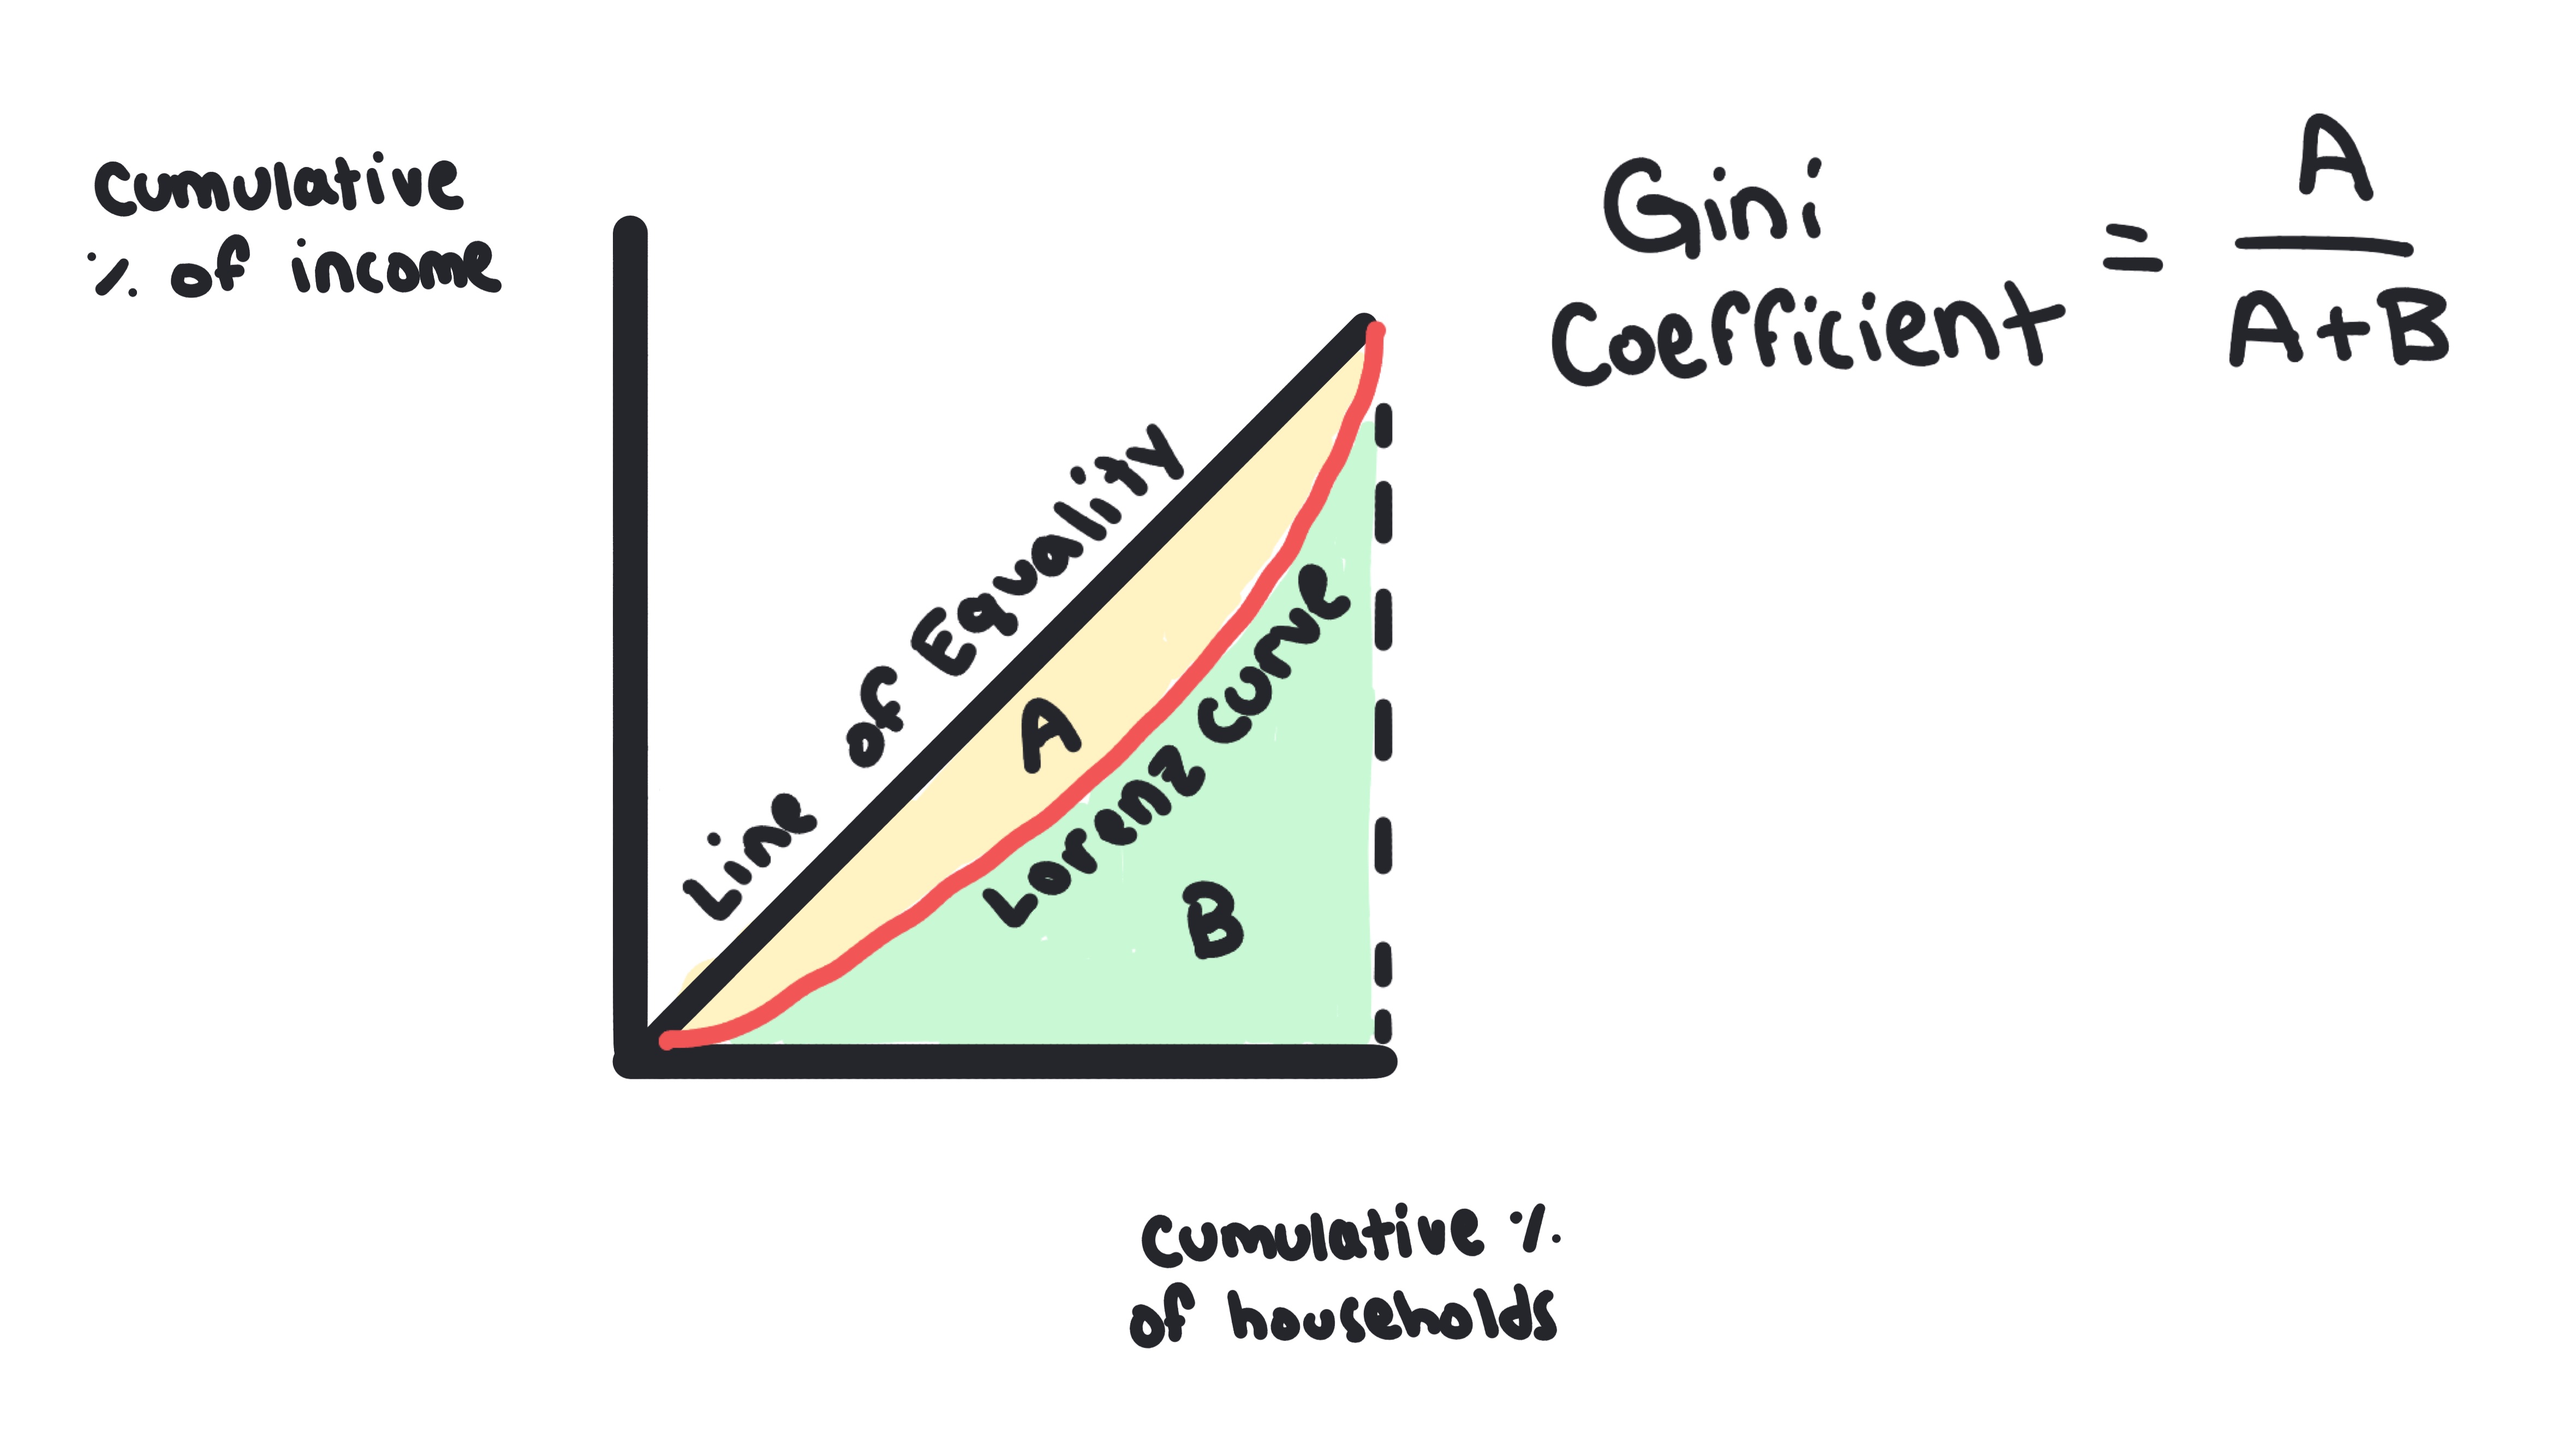
- •The government can measure this using the Lorenz Curve and Gini Coefficient.
Lorenz Curve
A graph that visually represents income inequality.
- •Plots the cumulative percentage of the population against the cumulative percentage of total income.
- •The "banana" shape between the line of perfect equality and the Lorenz curve represents the degree of inequality.
Gini Coefficient
A statistical measure of income inequality ranging from 0 to 1.
- •0 = Perfect Equality (everyone has same income).
- •1 = Perfect Inequality (one person has all the income).
- •Formula: Area A / (Area A + Area B).
Progressive Tax
A tax system where the tax rate increases as income increases.
- •Helps reduce income inequality.
- •Example: Current US Income Tax system.
Regressive Tax
A tax system where the tax rate decreases as income increases (or takes a larger percentage of income from the poor).
- •Increases income inequality.
- •Example: Sales tax (hits lower income earners harder as a % of their income).
Proportional Tax (Flat Tax)
A tax system where the tax rate remains the same regardless of income.
- •Example: A flat 20% tax on everyone.
Whiteboards